
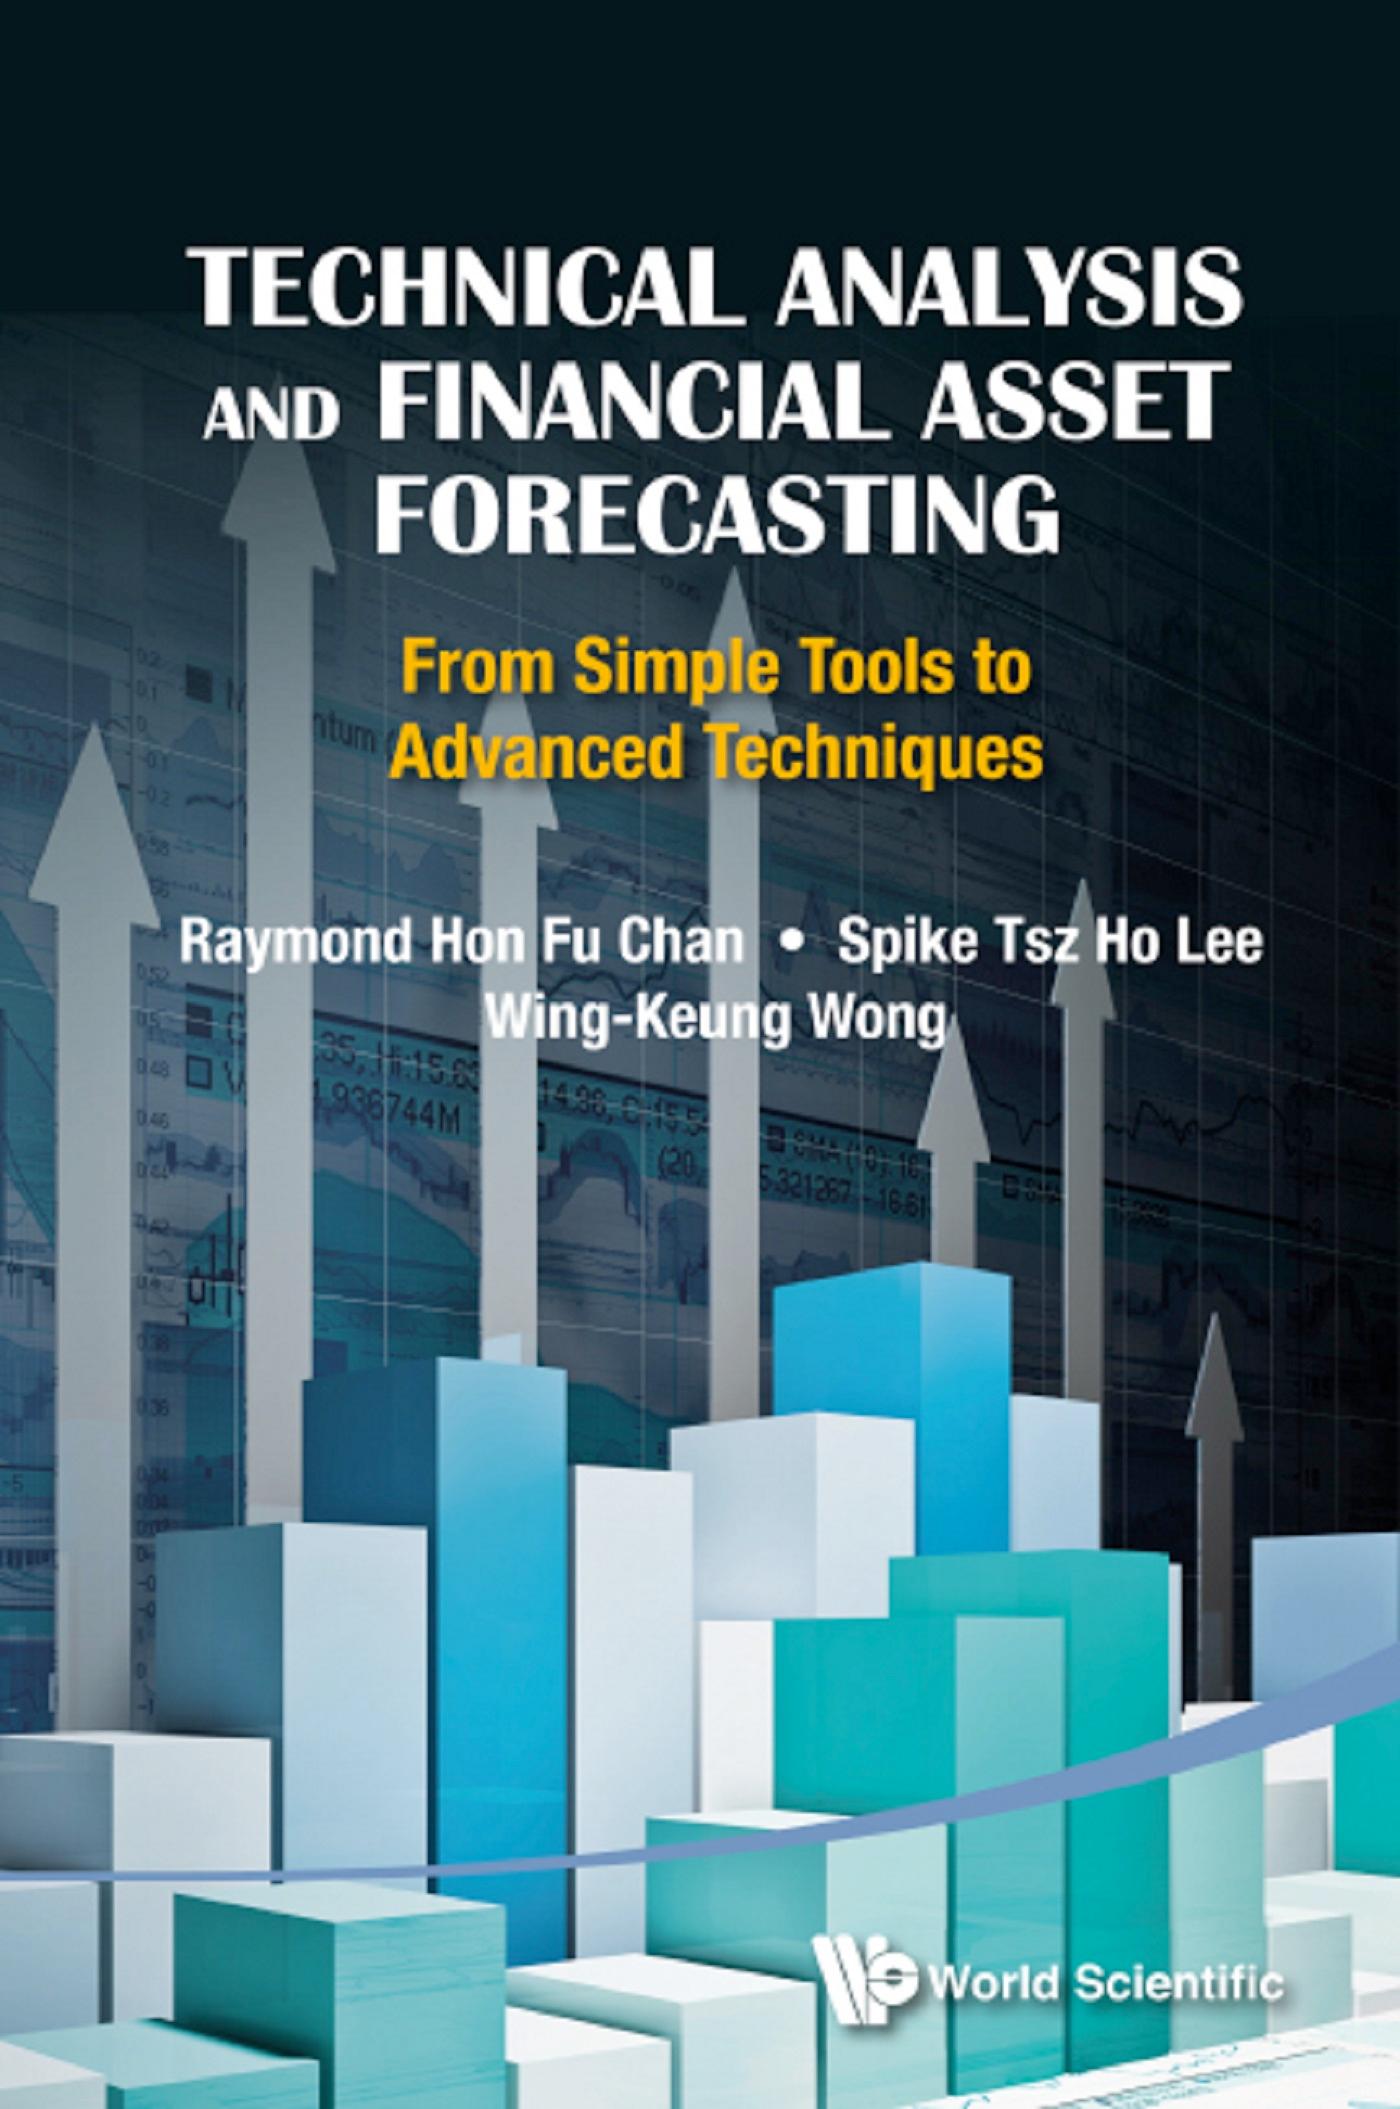
Technical analysis is defined as the tracking and prediction of asset price movements using charts and graphs in combination with various mathematical and statistical methods. More precisely, it is the quantitative criteria used in predicting the relative strength of buying and selling forces within a market to determine what to buy, what to sell, and when to execute trades. This book introduces simple technical analysis tools like moving averages and Bollinger bands, and also advanced techniques such as wavelets and empirical mode decomposition. It first discusses some traditional tools in technical analysis, such as trend, trend Line, trend channel, Gann's Theory, moving averages, and Bollinger bands. It then introduces a recent indicator developed for stock market and two recent techniques used in the technical analysis field: wavelets and the empirical mode decomposition in financial time series. The book also discusses the theory to test the performance of the indicators and introduces the MATLAB Financial Toolbox, some of the functions/codes of which are used in our numerical experiments.
Payez facilement par carte, Klarna, Apple Pay ou Google Pay. Pas satisfait ? Vous avez toujours une garantie de remboursement de 14 jours. En savoir plus dans nos conditions. Si vous avez des questions, envoyez-nous un e-mail à hello@memmo.org.
Memmo facilite tes études, où que tu sois dans le monde. On rassemble tes manuels de cours et des outils d'étude intelligents au même endroit : résumés, quiz, podcasts et flashcards. Et il y a Ted, ton compagnon d'étude qui répond à toutes tes questions. Plus de 50 000 étudiants étudient déjà ici – conçu pour t'aider à apprendre plus vite et à moins stresser.
Tu pourrais aussi aimer
Acheter le livre0