
See How Graphics Reveal Information
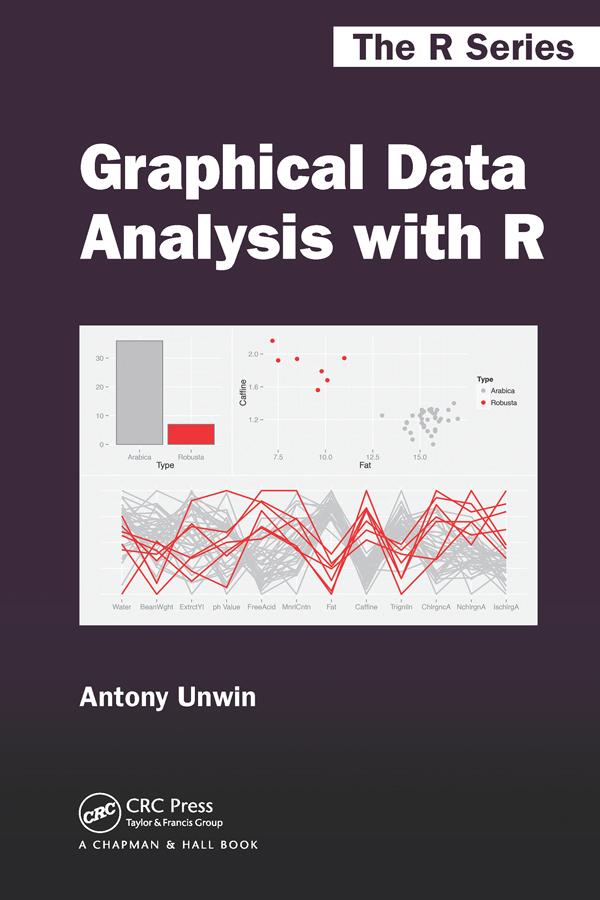
Graphical Data Analysis with R shows you what information you can gain from graphical displays. The book focuses on why you draw graphics to display data and which graphics to draw (and uses R to do so). All the datasets are available in R or one of its packages and the R code is available at rosuda.org/GDA.
Graphical data analysis is useful for data cleaning, exploring data structure, detecting outliers and unusual groups, identifying trends and clusters, spotting local patterns, evaluating modelling output, and presenting results. This book guides you in choosing graphics and understanding what information you can glean from them. It can be used as a primary text in a graphical data analysis course or as a supplement in a statistics course. Colour graphics are used throughout.
Pay easily by card, Klarna, Apple Pay or Google Pay. Not happy? You always have a 14-day money-back guarantee. Read more in our terms. If you have any questions, email us at hello@memmo.org.
Memmo makes studying easier – wherever you are in the world. We bring your course books and smart study tools together in one place: summaries, quizzes, podcasts and flashcards. Plus Ted, your study buddy who answers anything you wonder. Over 50,000 students already study here – built to help you learn faster and stress less.