
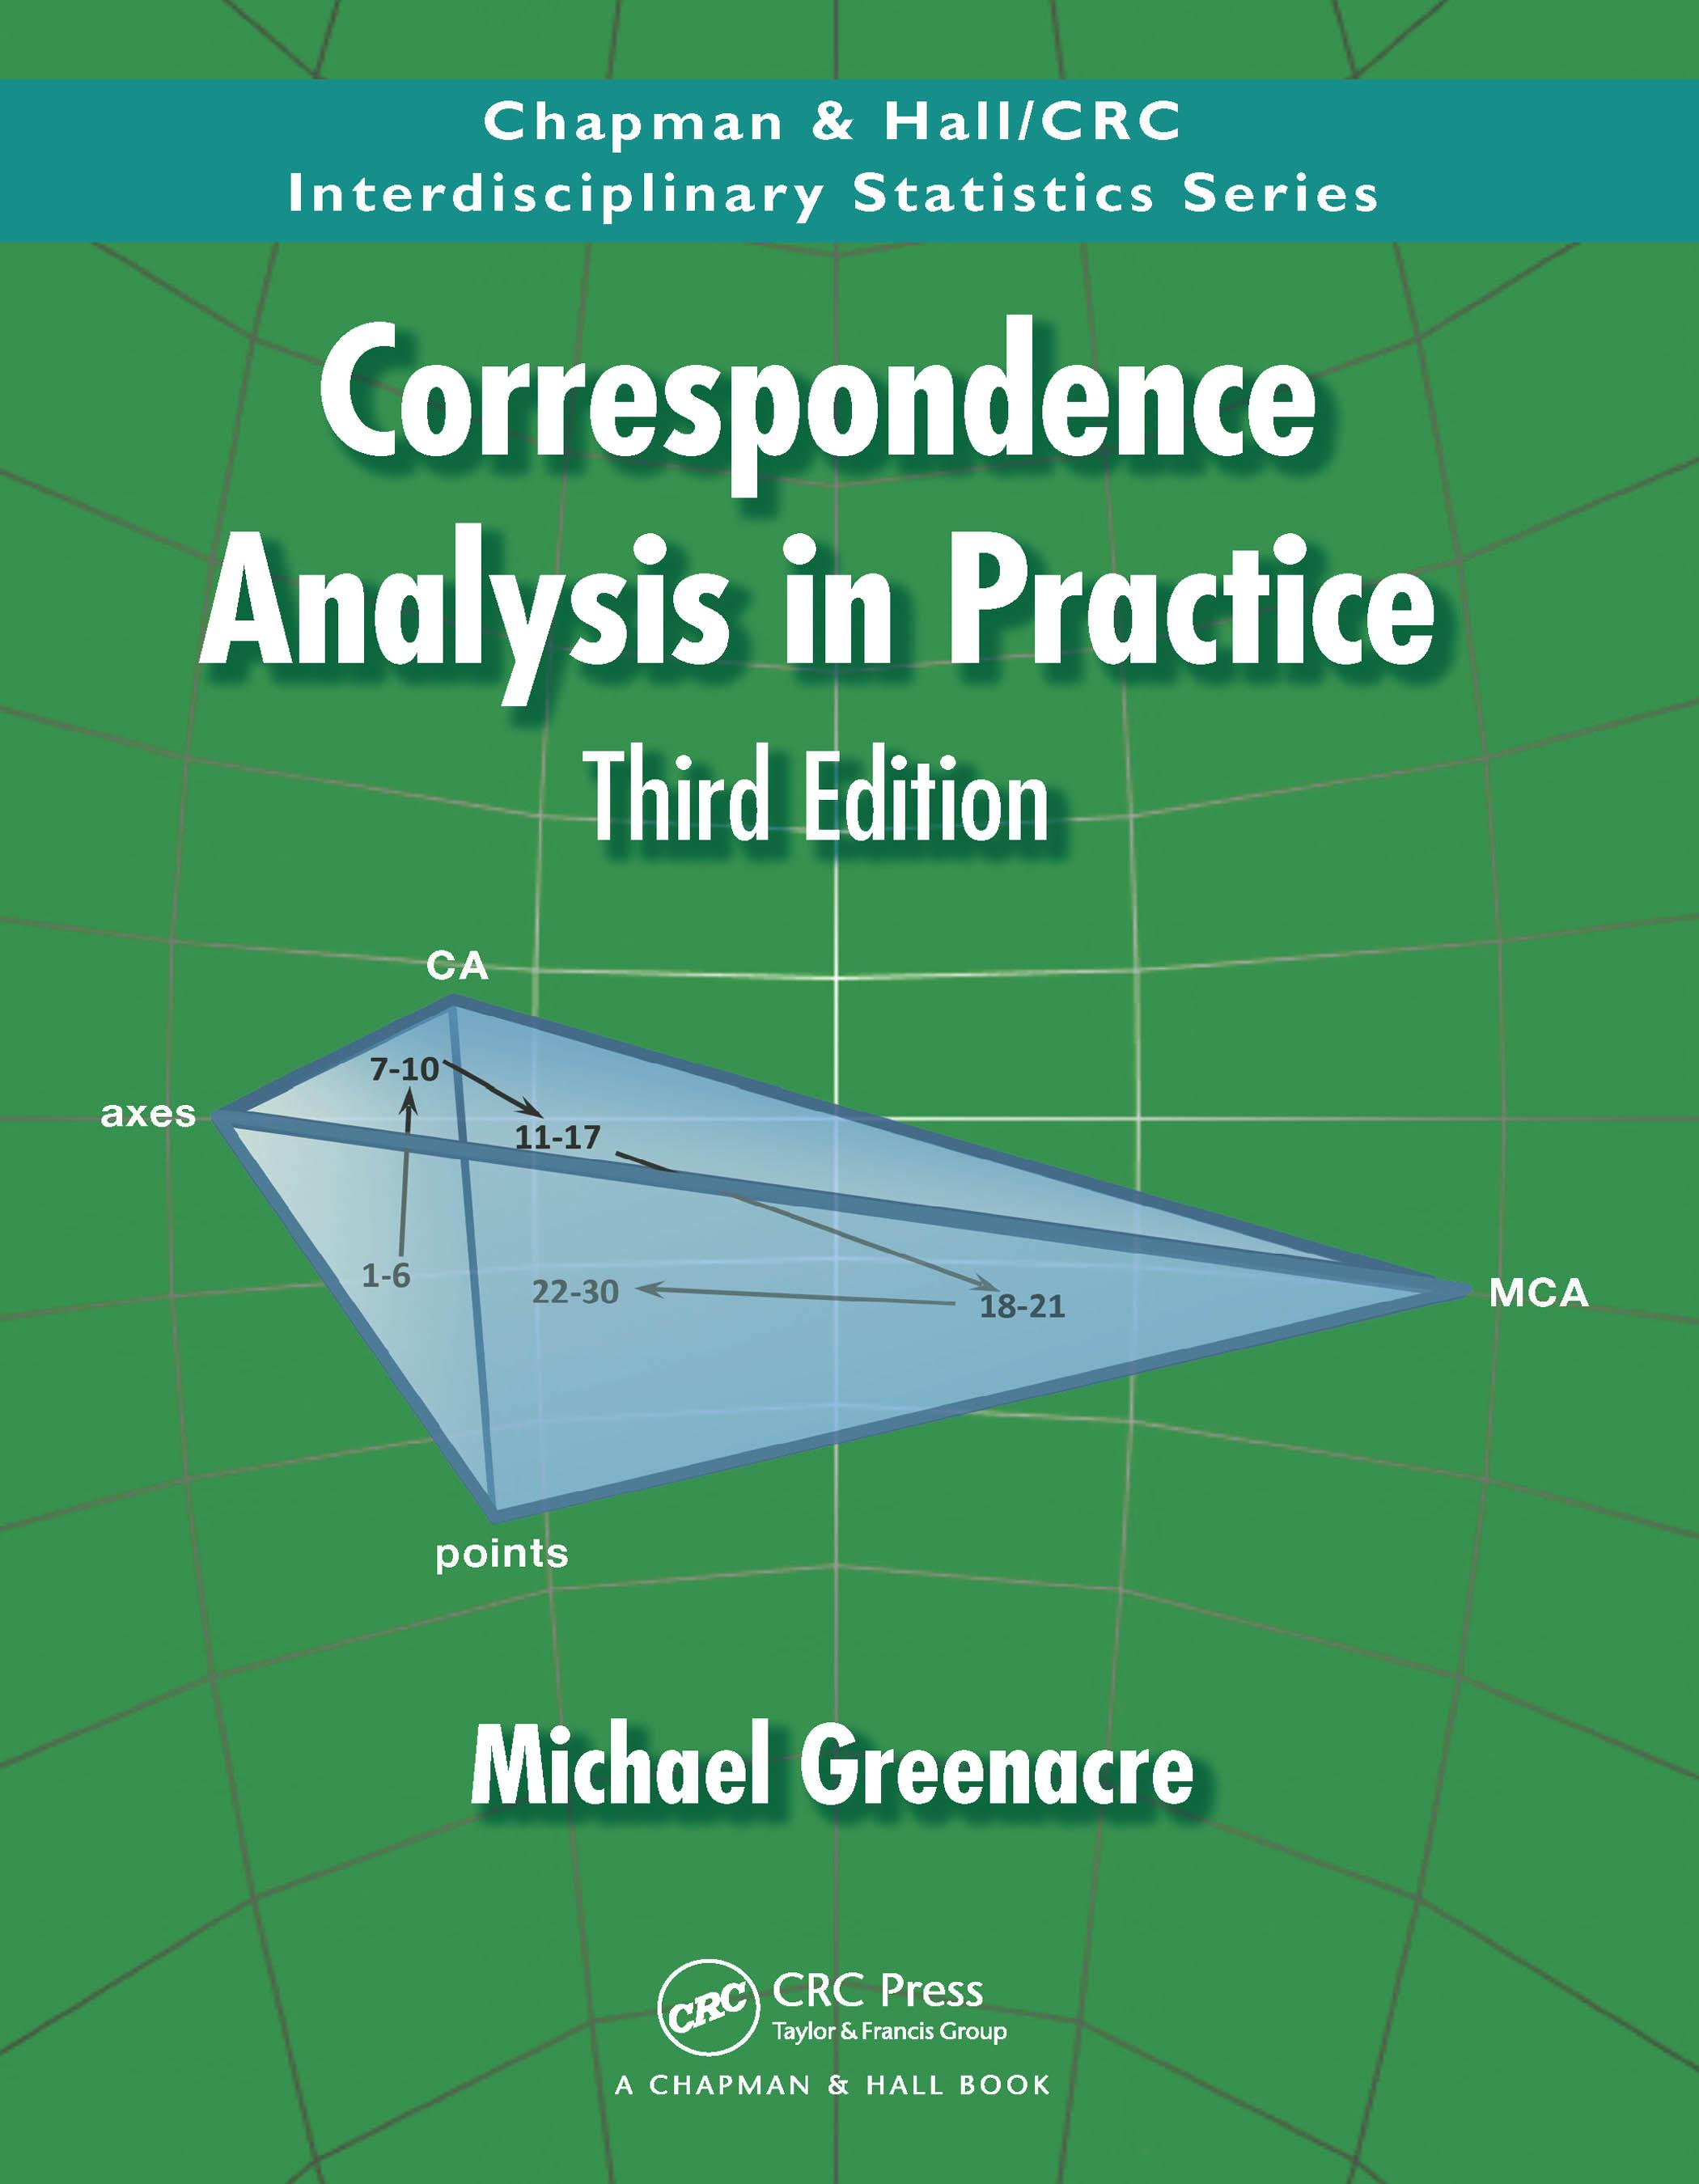
Drawing on the author’s 45 years of experience in multivariate analysis, Correspondence Analysis in Practice, Third Edition, shows how the versatile method of correspondence analysis (CA) can be used for data visualization in a wide variety of situations. CA and its variants, subset CA, multiple CA and joint CA, translate two-way and multi-way tables into more readable graphical forms — ideal for applications in the social, environmental and health sciences, as well as marketing, economics, linguistics, archaeology, and more.
Michael Greenacre is Professor of Statistics at the Universitat Pompeu Fabra, Barcelona, Spain, where he teaches a course, amongst others, on Data Visualization. He has authored and co-edited nine books and 80 journal articles and book chapters, mostly on correspondence analysis, the latest being Visualization and Verbalization of Data in 2015. He has given short courses in fifteen countries to environmental scientists, sociologists, data scientists and marketing professionals, and has specialized in statistics in ecology and social science.
Betal enkelt med kort, Klarna, Apple Pay eller Google Pay. Ikke fornøyd? Du har alltid 14 dagers angrerett. Les mer i våre vilkår. Har du spørsmål, send oss en e-post på hello@memmo.org.
Memmo gjør det enklere å studere – uansett hvor du er i verden. Hos oss samler du pensumbøker og smarte studieverktøy på ett og samme sted: sammendrag, quizer, podkaster og flashcards. Og så Ted, din studiekompis som svarer på alt du lurer på. Over 50 000 studenter studerer allerede her – bygget for at du skal lære raskere og stresse mindre.