
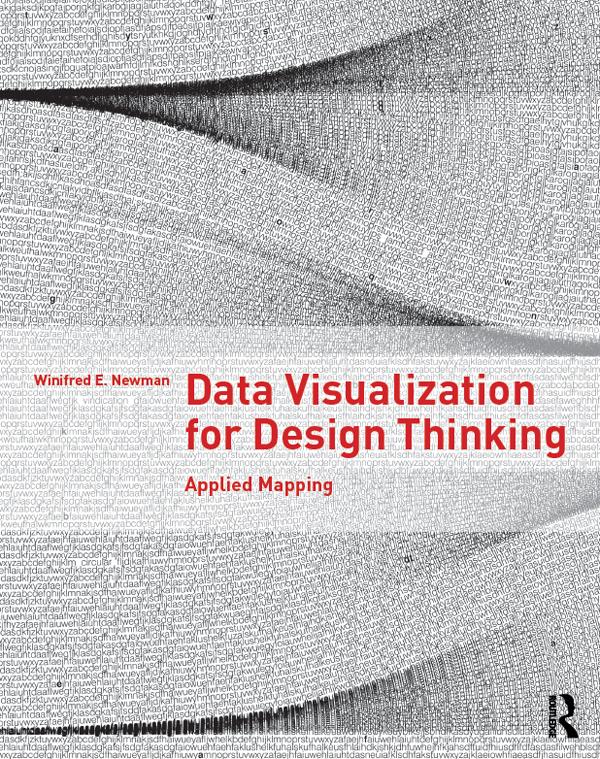
Data Visualization for Design Thinking helps you make better maps. Treating maps as applied research, you’ll be able to understand how to map sites, places, ideas, and projects, revealing the complex relationships between what you represent, your thinking, the technology you use, the culture you belong to, and your aesthetic practices. More than 100 examples illustrated with over 200 color images show you how to visualize data through mapping. Includes five in-depth cases studies and numerous examples throughout.
Pay easily by card, Klarna, Apple Pay or Google Pay. Not happy? You always have a 14-day money-back guarantee. Read more in our terms. If you have any questions, email us at hello@memmo.org.
Memmo makes studying easier – wherever you are in the world. We bring your course books and smart study tools together in one place: summaries, quizzes, podcasts and flashcards. Plus Ted, your study buddy who answers anything you wonder. Over 75,000 students already study here – built to help you learn faster and stress less.