
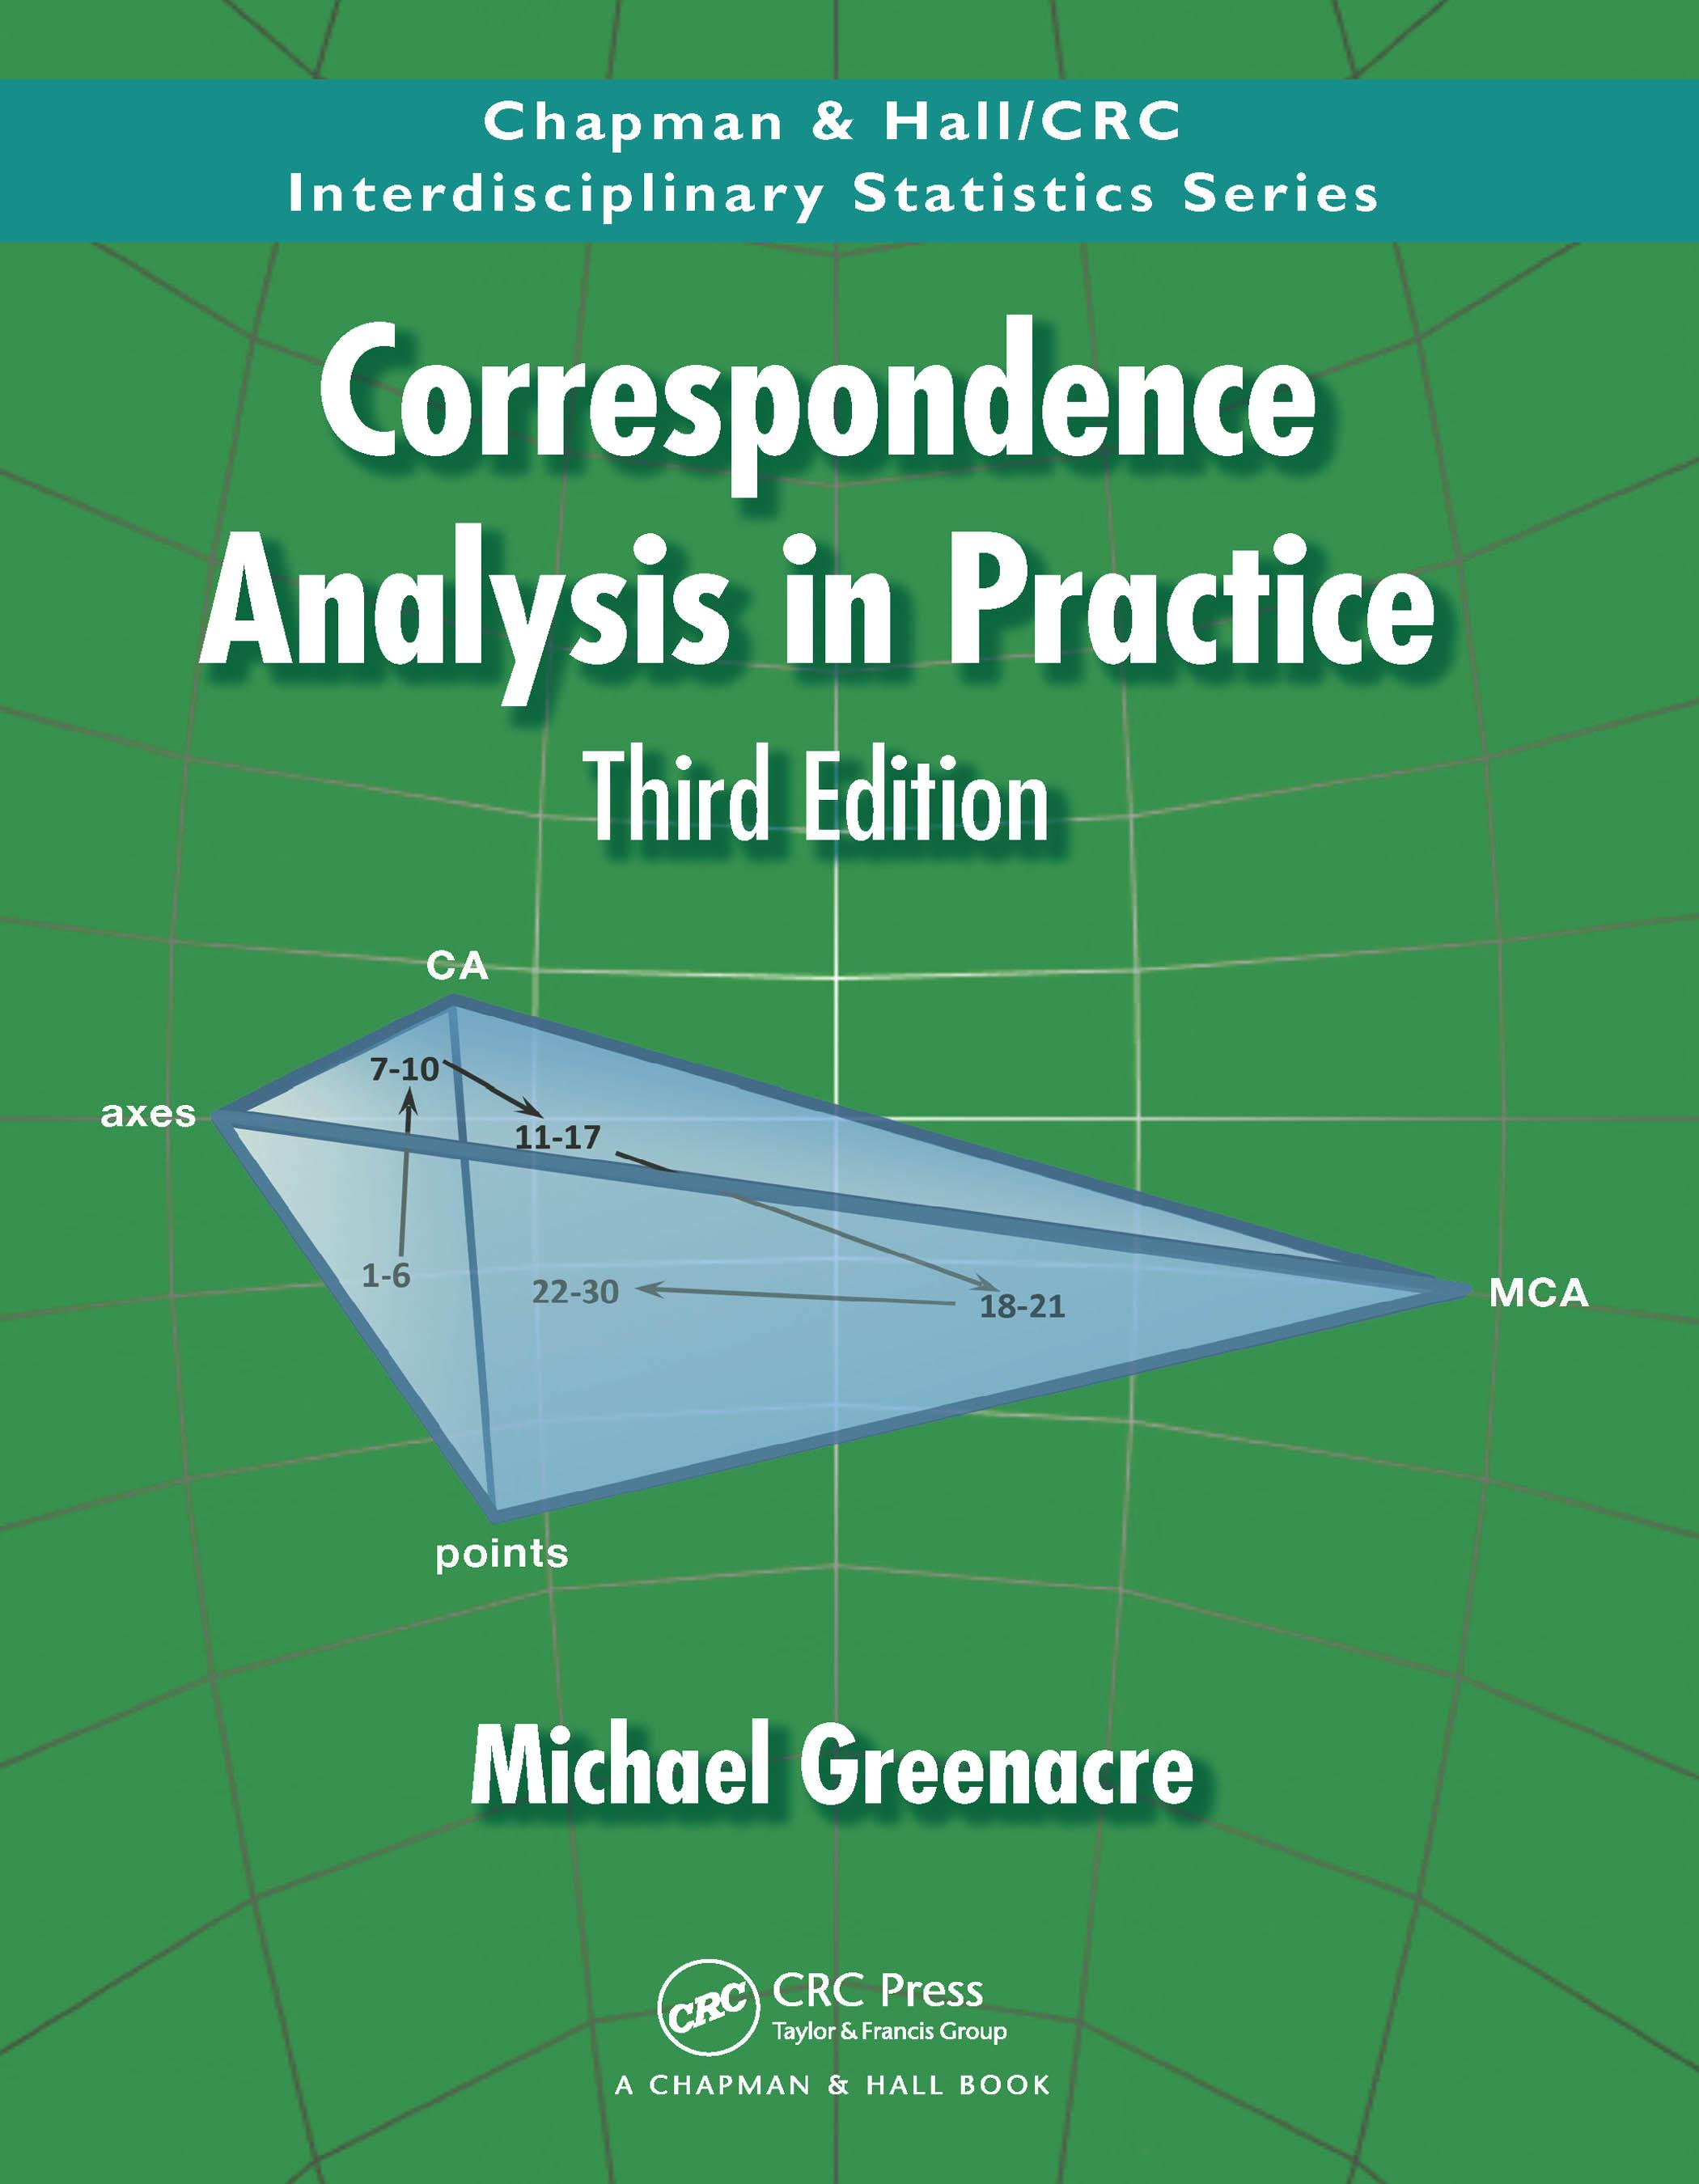
Drawing on the author’s 45 years of experience in multivariate analysis, Correspondence Analysis in Practice, Third Edition, shows how the versatile method of correspondence analysis (CA) can be used for data visualization in a wide variety of situations. CA and its variants, subset CA, multiple CA and joint CA, translate two-way and multi-way tables into more readable graphical forms — ideal for applications in the social, environmental and health sciences, as well as marketing, economics, linguistics, archaeology, and more.
Michael Greenacre is Professor of Statistics at the Universitat Pompeu Fabra, Barcelona, Spain, where he teaches a course, amongst others, on Data Visualization. He has authored and co-edited nine books and 80 journal articles and book chapters, mostly on correspondence analysis, the latest being Visualization and Verbalization of Data in 2015. He has given short courses in fifteen countries to environmental scientists, sociologists, data scientists and marketing professionals, and has specialized in statistics in ecology and social science.
Pay easily by card, Klarna, Apple Pay or Google Pay. Not happy? You always have a 14-day money-back guarantee. Read more in our terms. If you have any questions, email us at hello@memmo.org.
Memmo makes studying easier – wherever you are in the world. We bring your course books and smart study tools together in one place: summaries, quizzes, podcasts and flashcards. Plus Ted, your study buddy who answers anything you wonder. Over 75,000 students already study here – built to help you learn faster and stress less.