
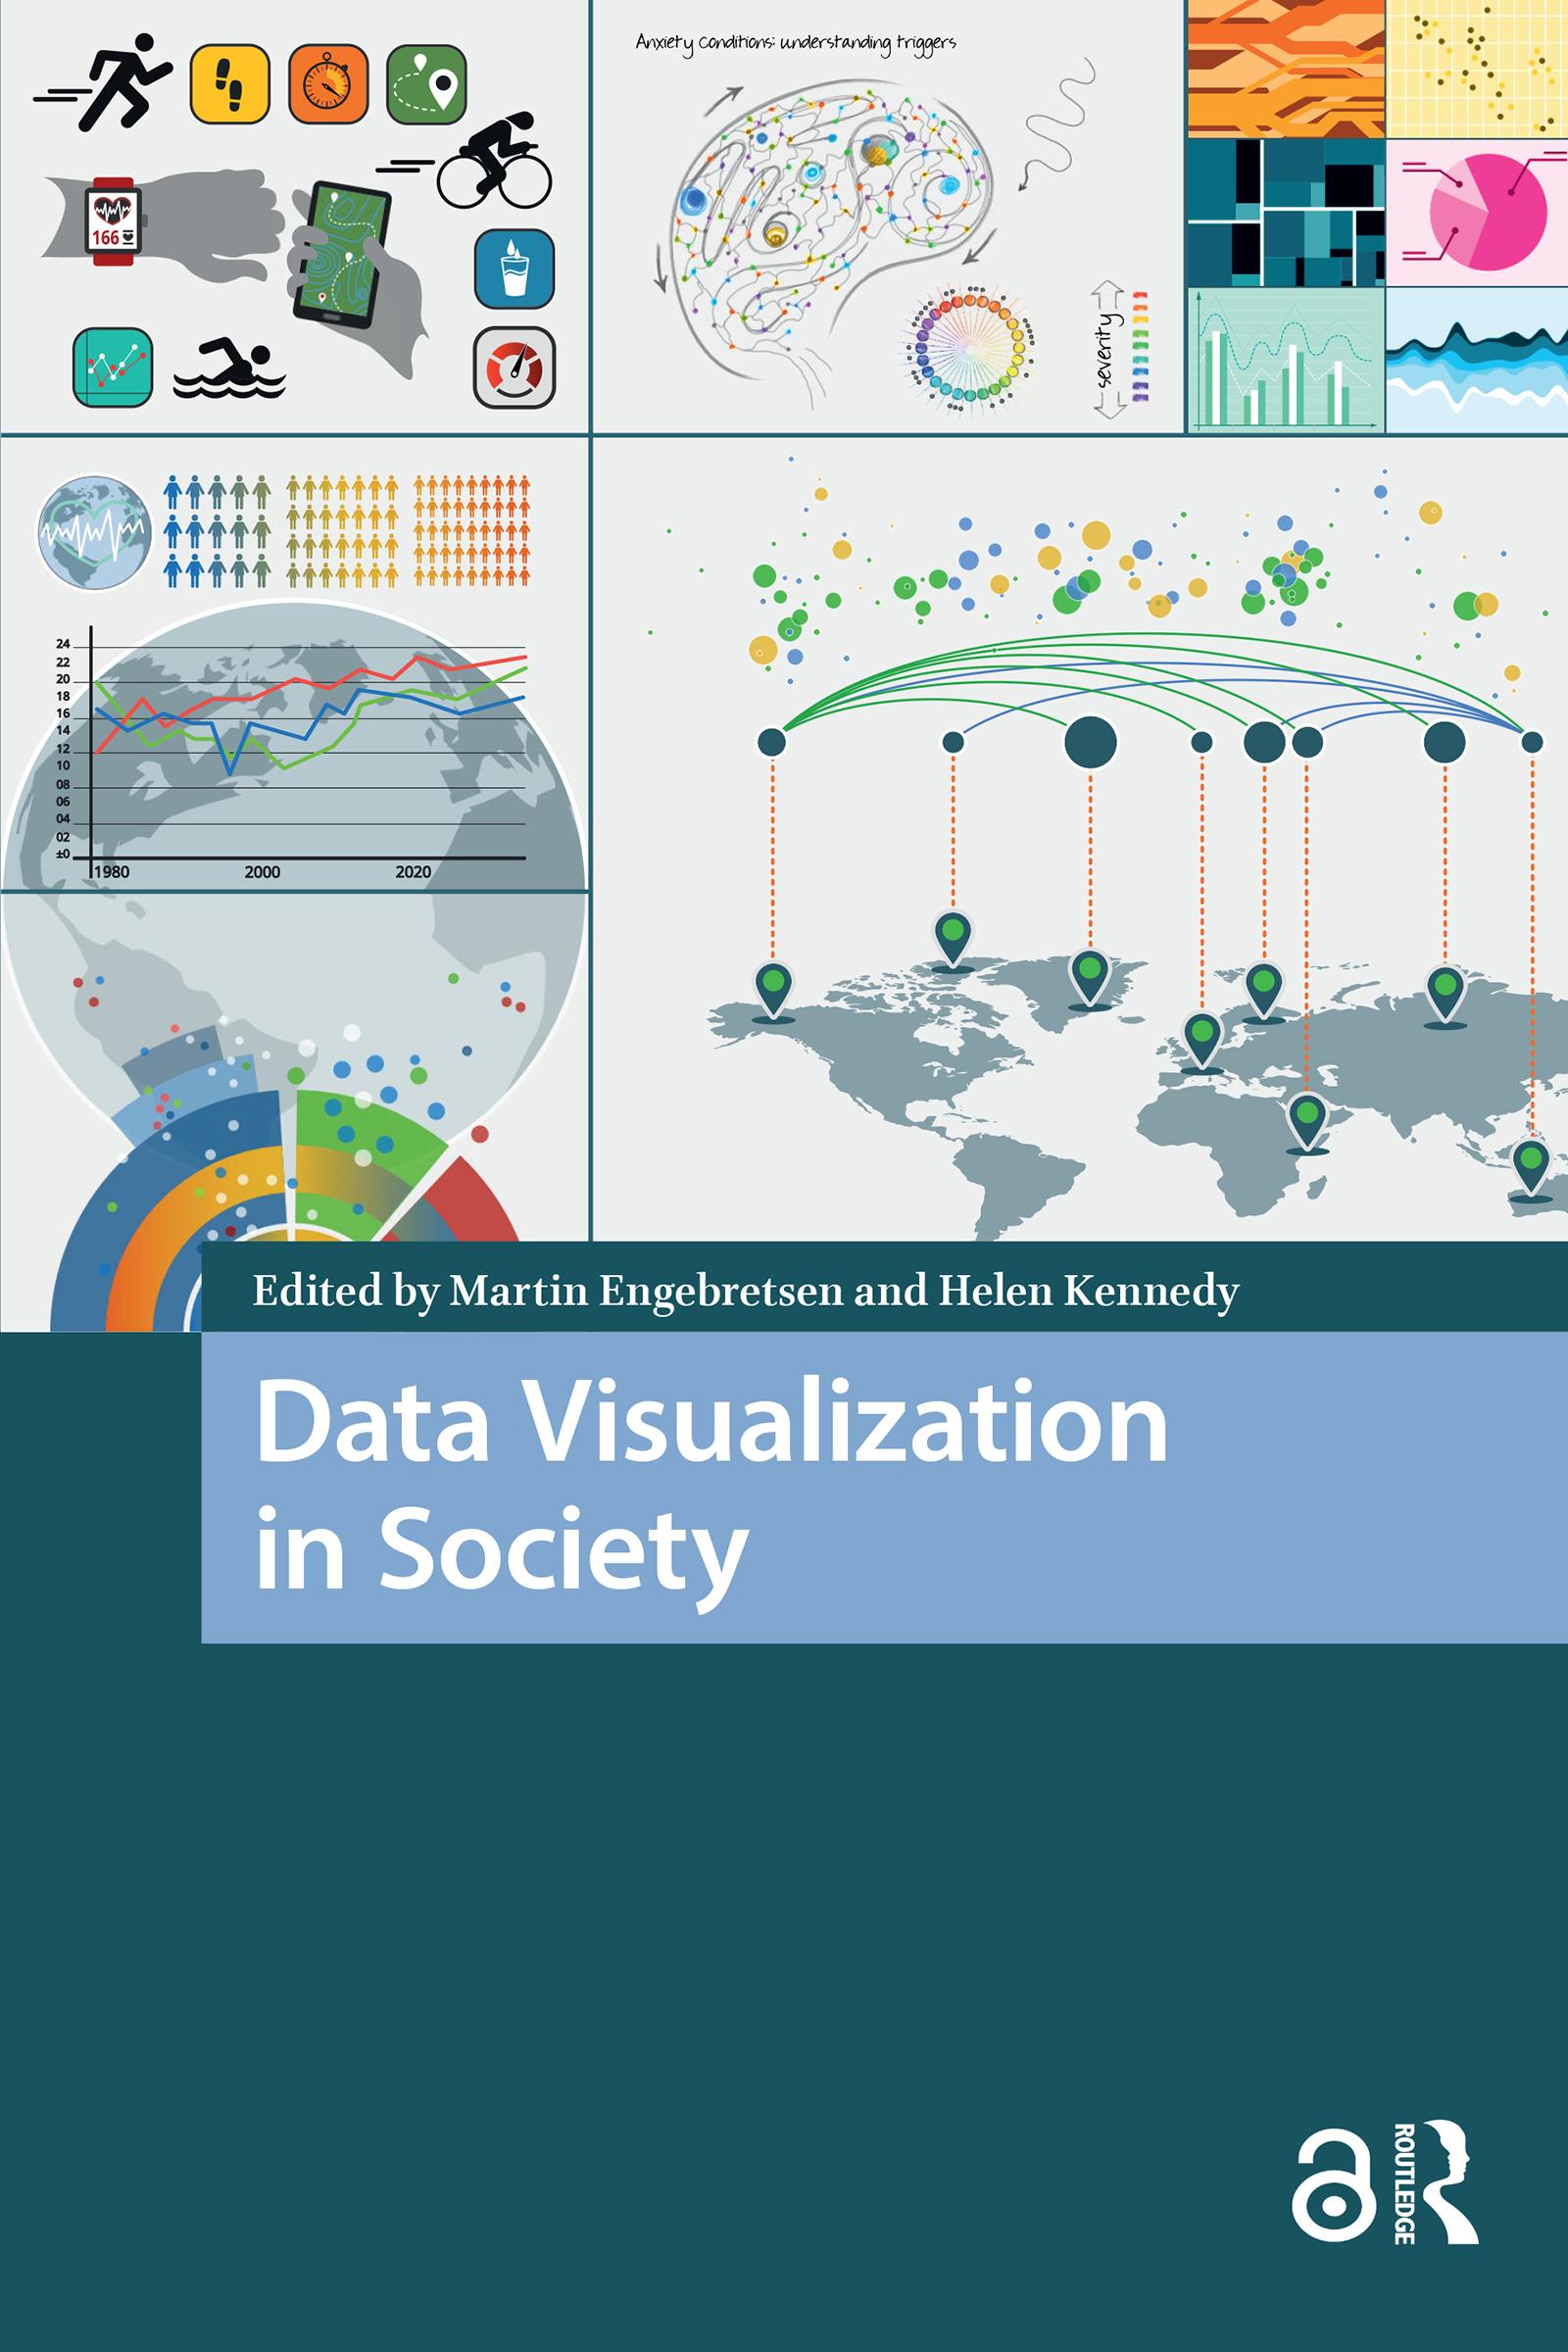
Today we are witnessing an increased use of data visualization in society. Across domains such as work, education and the news, various forms of graphs, charts and maps are used to explain, convince and tell stories. In an era in which more and more data are produced and circulated digitally, and digital tools make visualization production increasingly accessible, it is important to study the conditions under which such visual texts are generated, disseminated and thought to be of societal benefit. This book is a contribution to the multi-disciplined and multi-faceted conversation concerning the forms, uses and roles of data visualization in society. Do data visualizations do 'good' or 'bad'? Do they promote understanding and engagement, or do they do ideological work, privileging certain views of the world over others? The contributions in the book engage with these core questions from a range of disciplinary perspectives.
Pay easily by card, Klarna, Apple Pay or Google Pay. Not happy? You always have a 14-day money-back guarantee. Read more in our terms. If you have any questions, email us at hello@memmo.org.
Memmo makes studying easier – wherever you are in the world. We bring your course books and smart study tools together in one place: summaries, quizzes, podcasts and flashcards. Plus Ted, your study buddy who answers anything you wonder. Over 50,000 students already study here – built to help you learn faster and stress less.
You might also like
Buy the book0