
See How Graphics Reveal Information
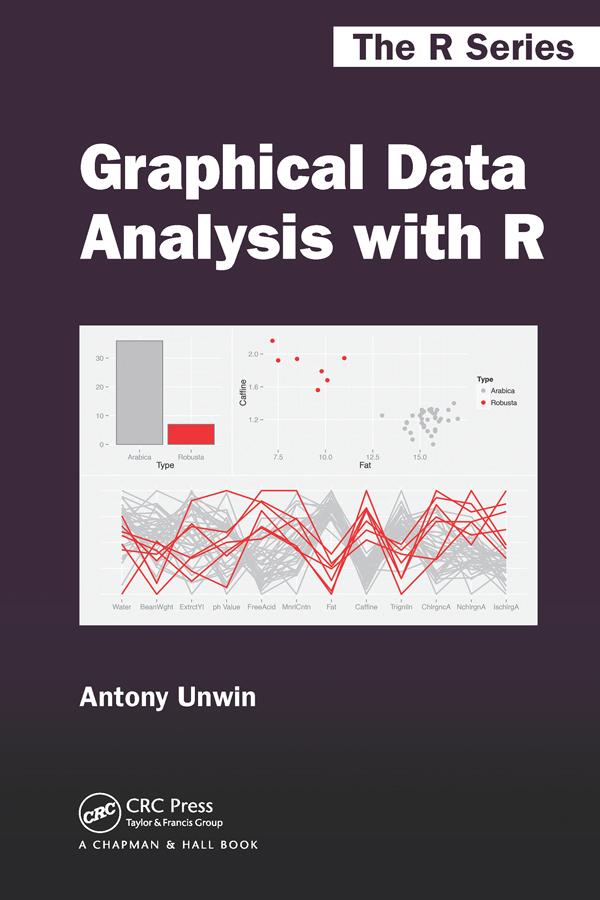
Graphical Data Analysis with R shows you what information you can gain from graphical displays. The book focuses on why you draw graphics to display data and which graphics to draw (and uses R to do so). All the datasets are available in R or one of its packages and the R code is available at rosuda.org/GDA.
Graphical data analysis is useful for data cleaning, exploring data structure, detecting outliers and unusual groups, identifying trends and clusters, spotting local patterns, evaluating modelling output, and presenting results. This book guides you in choosing graphics and understanding what information you can glean from them. It can be used as a primary text in a graphical data analysis course or as a supplement in a statistics course. Colour graphics are used throughout.
Betala smidigt med kort, Klarna, Apple Pay eller Google Pay. Är du inte nöjd har du alltid 14 dagars ångerrätt. Läs mer i våra villkor. Har du några frågor, mejla oss på hello@memmo.org.
Memmo gör det enklare att plugga – var du än är i världen. Hos oss samlar du kursböcker och smarta studieverktyg på ett och samma ställe: sammanfattningar, quiz, poddar och flashcards. Och så Ted, din studiekompis som svarar på allt du undrar. Över 50 000 studenter pluggar redan här – byggt för att du ska lära dig snabbare och stressa mindre.