
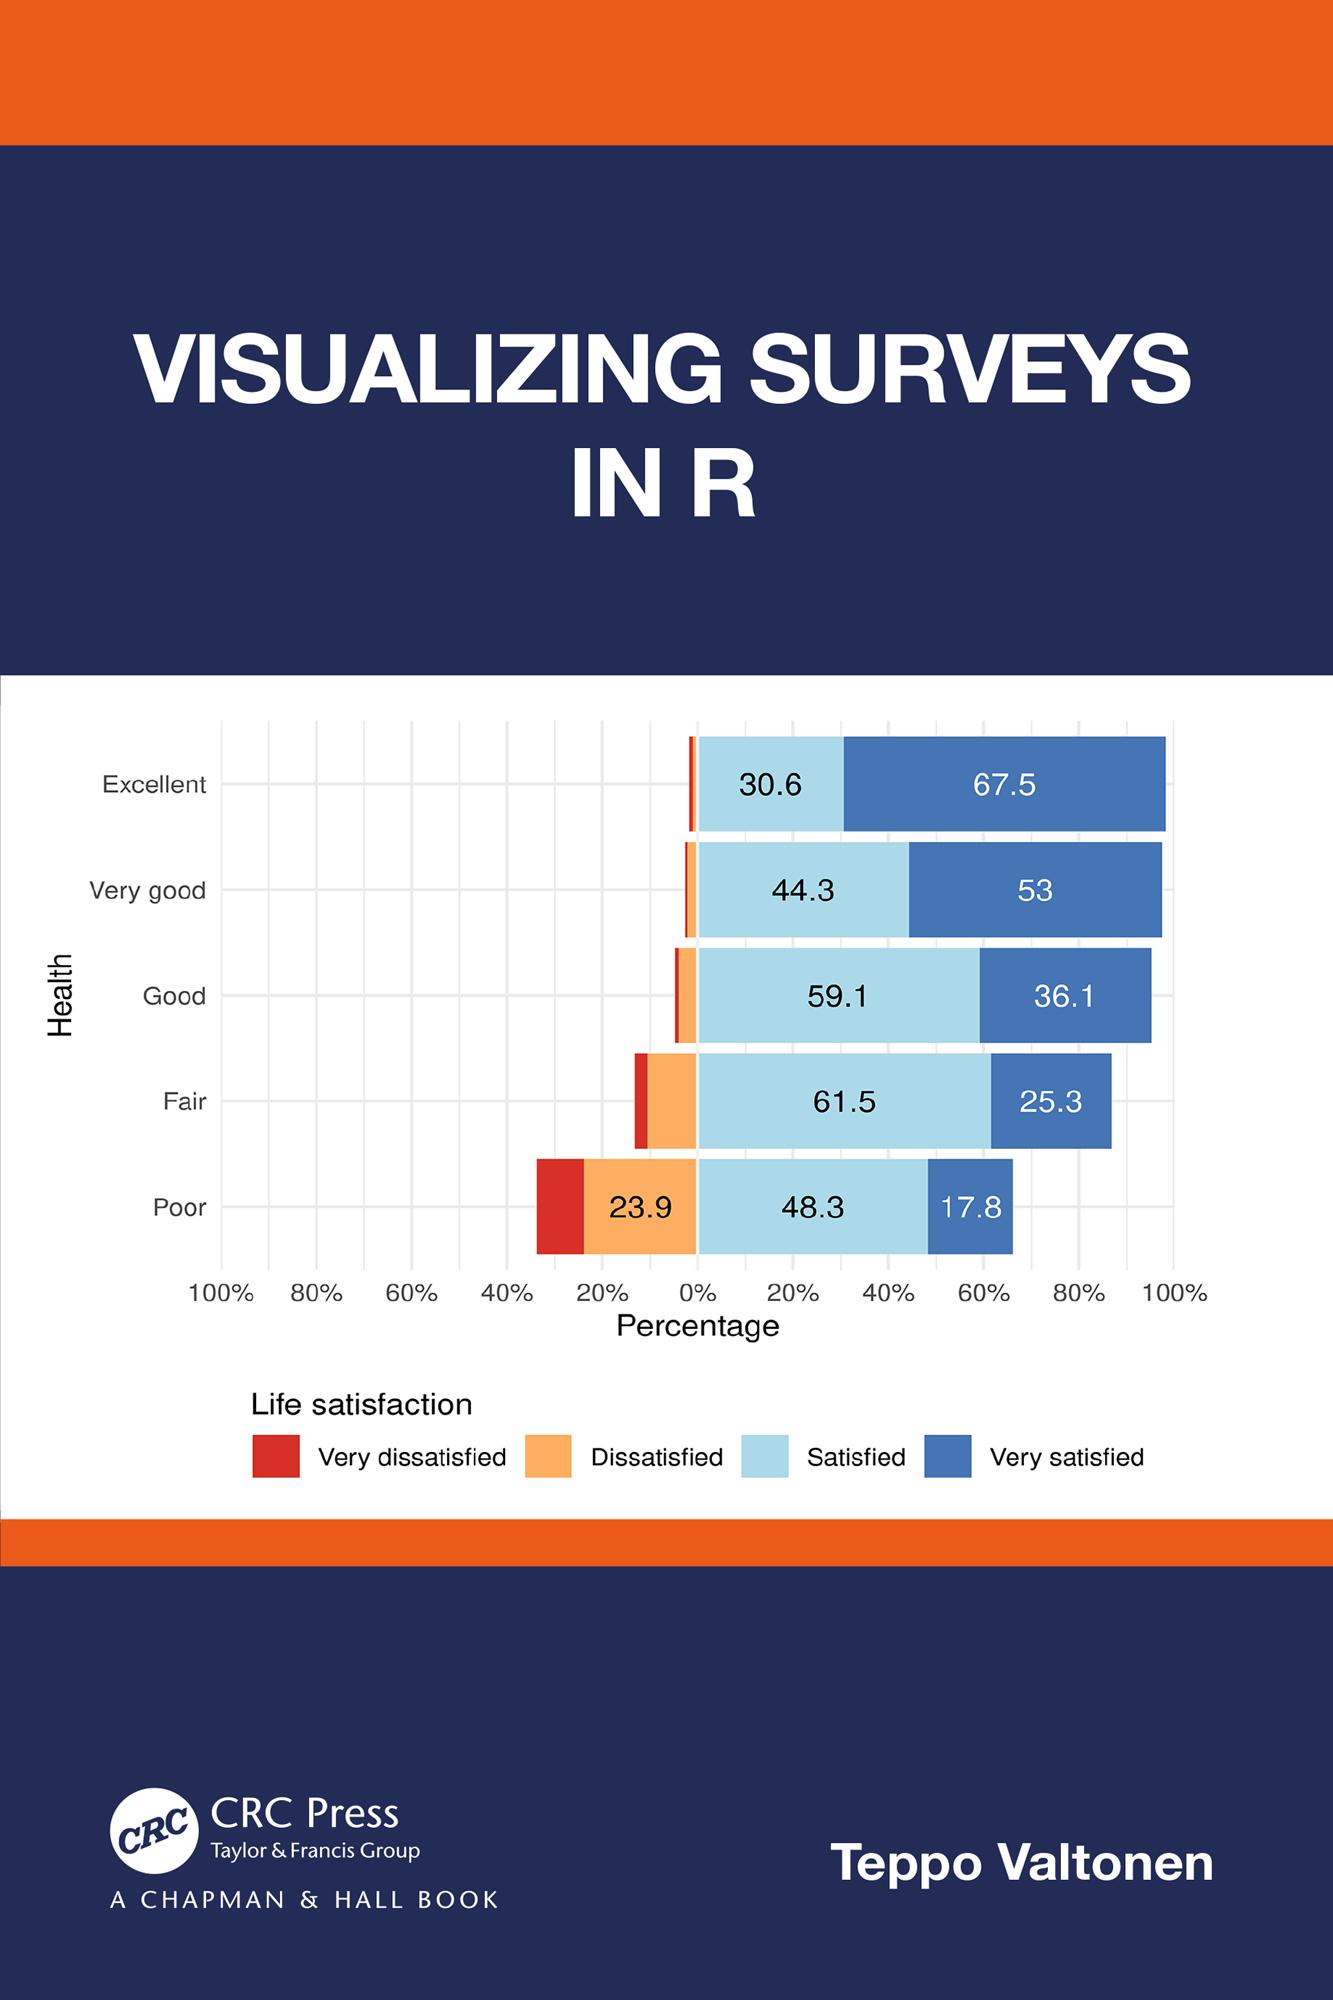
Visualizing Surveys in R is about creating static, print quality figures from survey data using R. The focus is not, for example, on statistical analysis of survey data, but rather on giving concrete solutions for typical problems in visualizing survey data. While there are many excellent books on data visualization, surveys and R, the aim of this book is to bring these topics together, and offer practical instructions for visualizing surveys in R.
Features
- Introduction to survey data: variables, categories, and scales
- Description of a process for visualizing survey data
- Recommendations for reading survey data into R
- Advice on building a survey dataset in R to facilitate versatile plotting
- Step-by-step recipes in R for creating useful plots from survey data
The book is intended for researchers who regularly use surveys and are interested in learning how to seize the vast possibilities and the flexibility of R in survey analysis and visualizations. The book is also valuable for psychologists, marketeers, HR personnel, managers, and other professionals who wish to standardize and automate the process for visualizing survey data. Finally, the book is suitable as a course textbook, either more widely on survey studies, or more strictly on visualizing survey data in R.
Betala smidigt med kort, Klarna, Apple Pay eller Google Pay. Är du inte nöjd har du alltid 14 dagars ångerrätt. Läs mer i våra villkor. Har du några frågor, mejla oss på hello@memmo.org.
Memmo gör det enklare att plugga – var du än är i världen. Hos oss samlar du kursböcker och smarta studieverktyg på ett och samma ställe: sammanfattningar, quiz, poddar och flashcards. Och så Ted, din studiekompis som svarar på allt du undrar. Över 50 000 studenter pluggar redan här – byggt för att du ska lära dig snabbare och stressa mindre.