
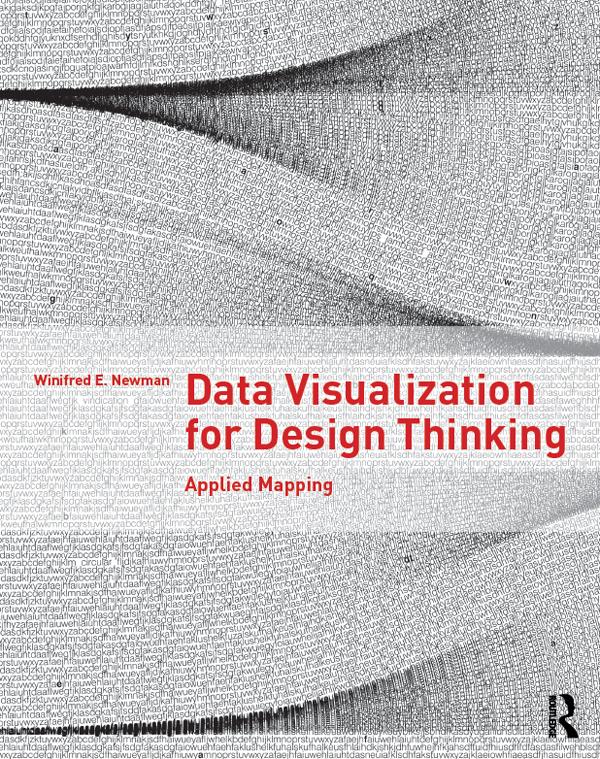
Data Visualization for Design Thinking helps you make better maps. Treating maps as applied research, you’ll be able to understand how to map sites, places, ideas, and projects, revealing the complex relationships between what you represent, your thinking, the technology you use, the culture you belong to, and your aesthetic practices. More than 100 examples illustrated with over 200 color images show you how to visualize data through mapping. Includes five in-depth cases studies and numerous examples throughout.
Betal enkelt med kort, Klarna, Apple Pay eller Google Pay. Ikke fornøyd? Du har alltid 14 dagers angrerett. Les mer i våre vilkår. Har du spørsmål, send oss en e-post på hello@memmo.org.
Memmo gjør det enklere å studere – uansett hvor du er i verden. Hos oss samler du pensumbøker og smarte studieverktøy på ett og samme sted: sammendrag, quizer, podkaster og flashcards. Og så Ted, din studiekompis som svarer på alt du lurer på. Over 50 000 studenter studerer allerede her – bygget for at du skal lære raskere og stresse mindre.