
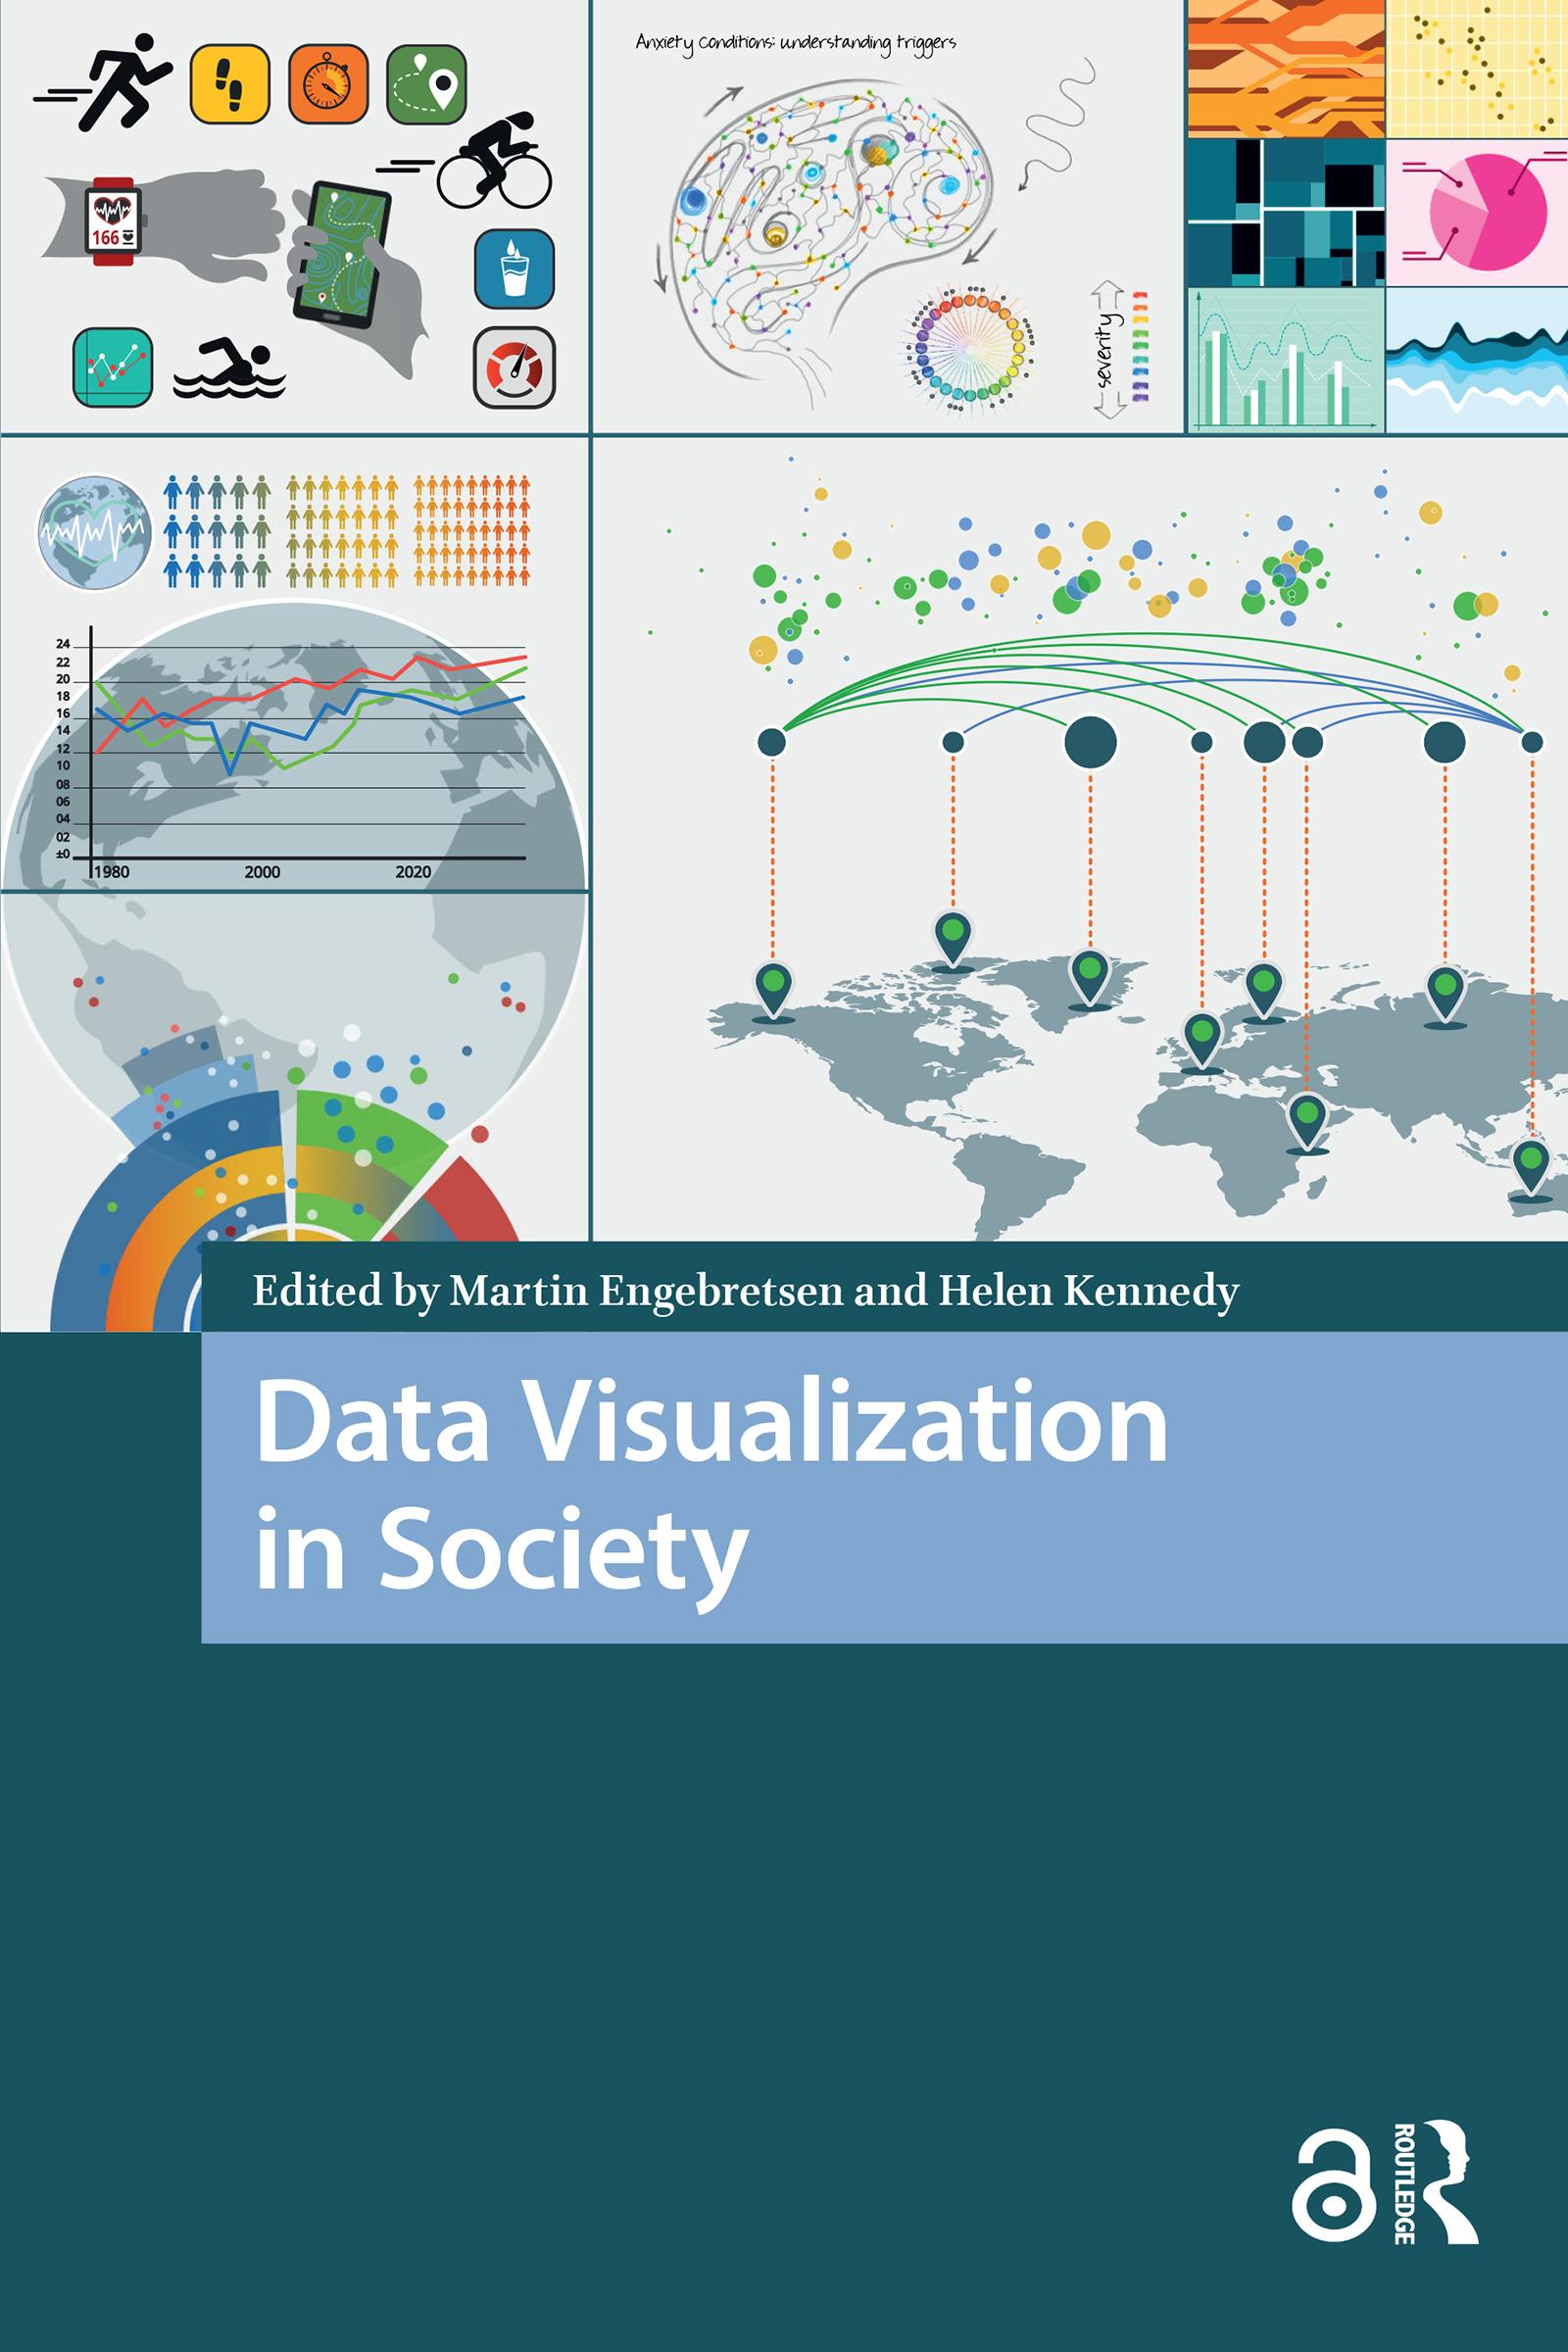
Today we are witnessing an increased use of data visualization in society. Across domains such as work, education and the news, various forms of graphs, charts and maps are used to explain, convince and tell stories. In an era in which more and more data are produced and circulated digitally, and digital tools make visualization production increasingly accessible, it is important to study the conditions under which such visual texts are generated, disseminated and thought to be of societal benefit. This book is a contribution to the multi-disciplined and multi-faceted conversation concerning the forms, uses and roles of data visualization in society. Do data visualizations do 'good' or 'bad'? Do they promote understanding and engagement, or do they do ideological work, privileging certain views of the world over others? The contributions in the book engage with these core questions from a range of disciplinary perspectives.
Betal enkelt med kort, Klarna, Apple Pay eller Google Pay. Ikke fornøyd? Du har alltid 14 dagers angrerett. Les mer i våre vilkår. Har du spørsmål, send oss en e-post på hello@memmo.org.
Memmo gjør det enklere å studere – uansett hvor du er i verden. Hos oss samler du pensumbøker og smarte studieverktøy på ett og samme sted: sammendrag, quizer, podkaster og flashcards. Og så Ted, din studiekompis som svarer på alt du lurer på. Over 50 000 studenter studerer allerede her – bygget for at du skal lære raskere og stresse mindre.
Du vil kanskje også like
Kjøp boken0