
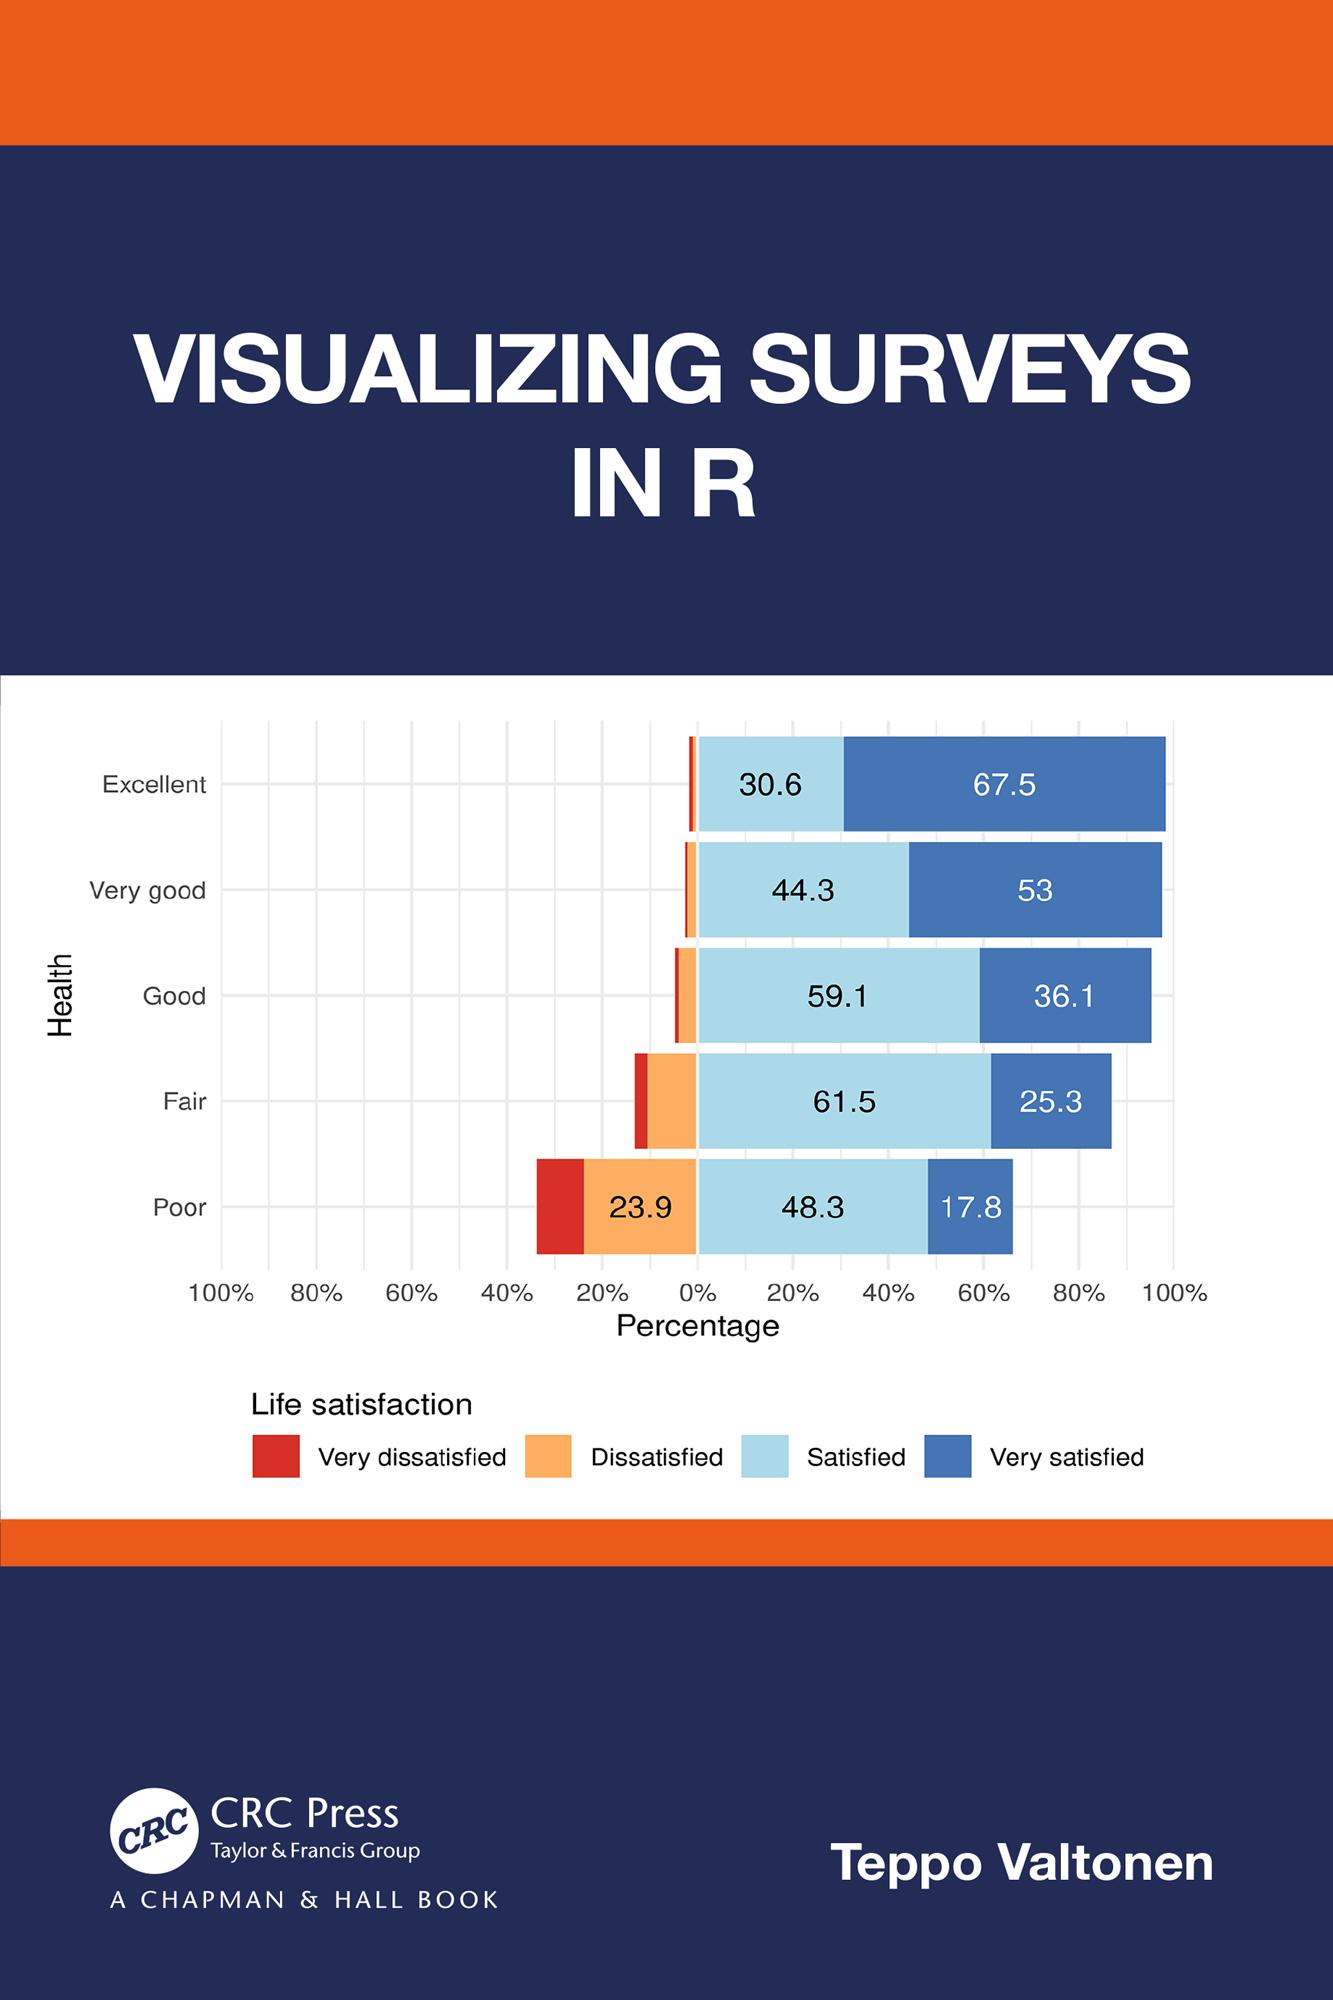
Visualizing Surveys in R is about creating static, print quality figures from survey data using R. The focus is not, for example, on statistical analysis of survey data, but rather on giving concrete solutions for typical problems in visualizing survey data. While there are many excellent books on data visualization, surveys and R, the aim of this book is to bring these topics together, and offer practical instructions for visualizing surveys in R.
Features
- Introduction to survey data: variables, categories, and scales
- Description of a process for visualizing survey data
- Recommendations for reading survey data into R
- Advice on building a survey dataset in R to facilitate versatile plotting
- Step-by-step recipes in R for creating useful plots from survey data
The book is intended for researchers who regularly use surveys and are interested in learning how to seize the vast possibilities and the flexibility of R in survey analysis and visualizations. The book is also valuable for psychologists, marketeers, HR personnel, managers, and other professionals who wish to standardize and automate the process for visualizing survey data. Finally, the book is suitable as a course textbook, either more widely on survey studies, or more strictly on visualizing survey data in R.
Betal enkelt med kort, Klarna, Apple Pay eller Google Pay. Ikke fornøyd? Du har alltid 14 dagers angrerett. Les mer i våre vilkår. Har du spørsmål, send oss en e-post på hello@memmo.org.
Memmo gjør det enklere å studere – uansett hvor du er i verden. Hos oss samler du pensumbøker og smarte studieverktøy på ett og samme sted: sammendrag, quizer, podkaster og flashcards. Og så Ted, din studiekompis som svarer på alt du lurer på. Over 50 000 studenter studerer allerede her – bygget for at du skal lære raskere og stresse mindre.