
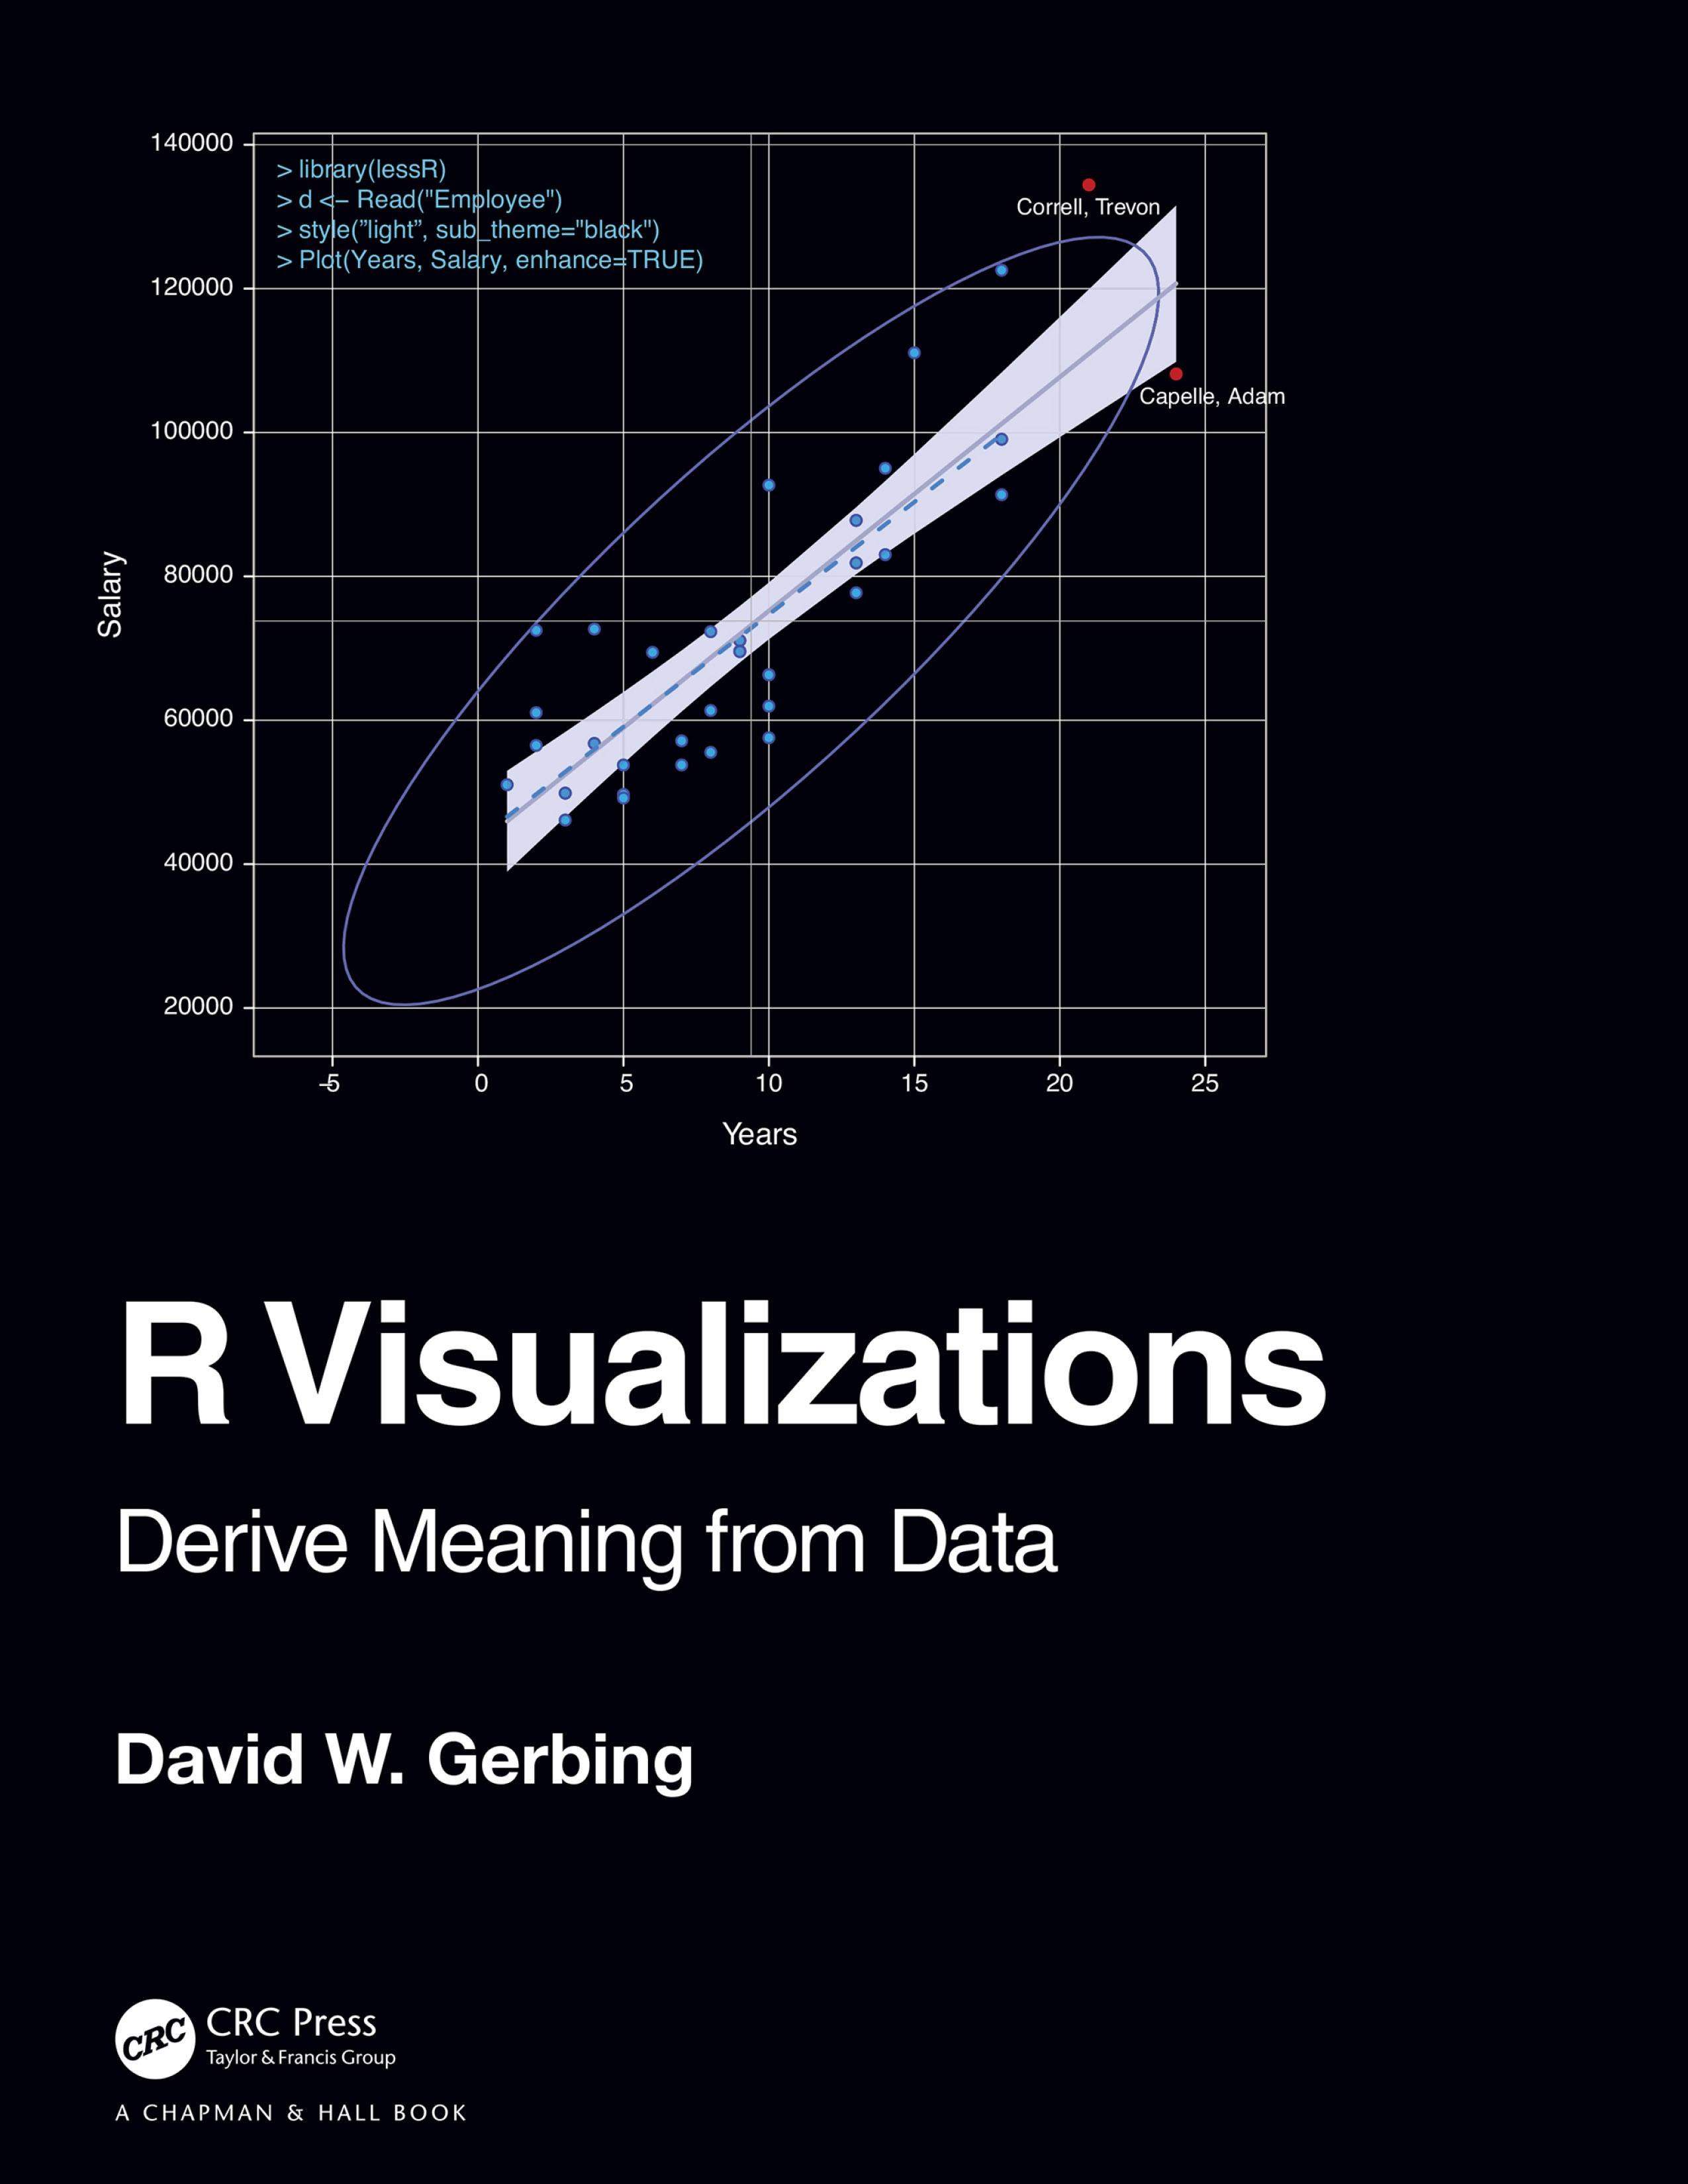
R Visualizations: Derive Meaning from Data focuses on one of the two major topics of data analytics: data visualization, a.k.a., computer graphics. In the book, major R systems for visualization are discussed, organized by topic and not by system. Anyone doing data analysis will be shown how to use R to generate any of the basic visualizations with the R visualization systems. Further, this book introduces the author’s lessR system, which always can accomplish a visualization with less coding than the use of other systems, sometimes dramatically so, and also provides accompanying statistical analyses.
Key Features
- Presents thorough coverage of the leading R visualization system, ggplot2.
- Gives specific guidance on using base R graphics to attain visualizations of the same quality as those provided by ggplot2.
-
Shows how to create a wide range of data visualizations: distributions of categorical and continuous variables, many types of scatterplots including with a third variable, time series, and maps.
- Inclusion of the various approaches to R graphics organized by topic instead of by system.
- Presents the recent work on interactive visualization in R.
David W. Gerbing received his PhD from Michigan State University in 1979 in quantitative analysis, and currently is a professor of quantitative analysis in the School of Business at Portland State University. He has published extensively in the social and behavioral sciences with a focus on quantitative methods. His lessR package has been in development since 2009.
Betal enkelt med kort, Klarna, Apple Pay eller Google Pay. Ikke fornøyd? Du har alltid 14 dagers angrerett. Les mer i våre vilkår. Har du spørsmål, send oss en e-post på hello@memmo.org.
Memmo gjør det enklere å studere – uansett hvor du er i verden. Hos oss samler du pensumbøker og smarte studieverktøy på ett og samme sted: sammendrag, quizer, podkaster og flashcards. Og så Ted, din studiekompis som svarer på alt du lurer på. Over 50 000 studenter studerer allerede her – bygget for at du skal lære raskere og stresse mindre.