
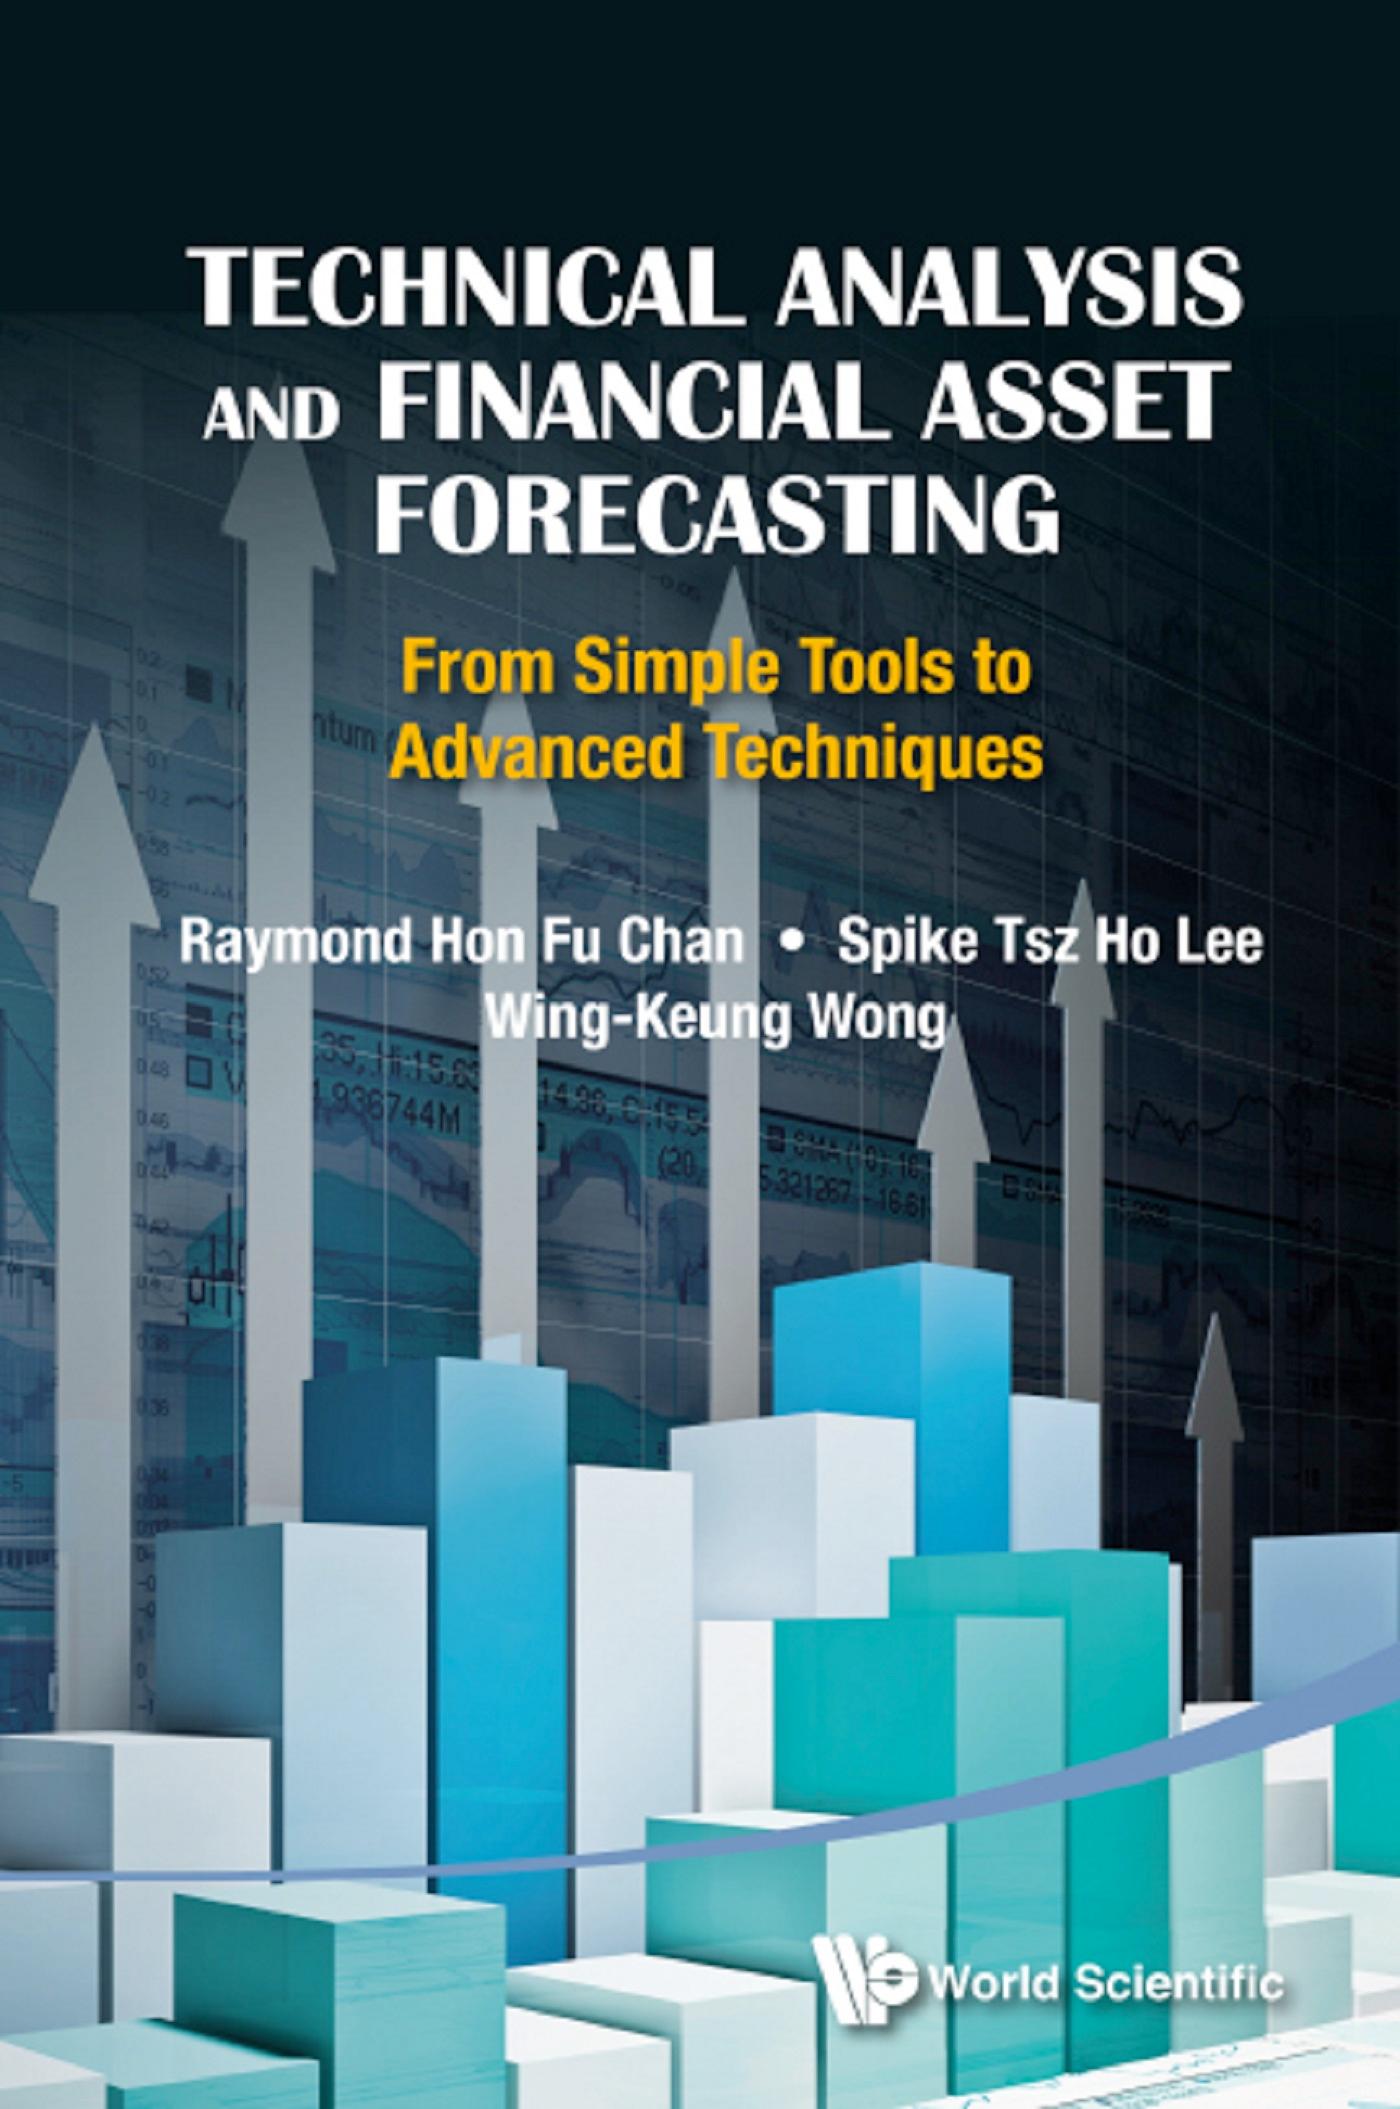
Technical analysis is defined as the tracking and prediction of asset price movements using charts and graphs in combination with various mathematical and statistical methods. More precisely, it is the quantitative criteria used in predicting the relative strength of buying and selling forces within a market to determine what to buy, what to sell, and when to execute trades. This book introduces simple technical analysis tools like moving averages and Bollinger bands, and also advanced techniques such as wavelets and empirical mode decomposition. It first discusses some traditional tools in technical analysis, such as trend, trend Line, trend channel, Gann's Theory, moving averages, and Bollinger bands. It then introduces a recent indicator developed for stock market and two recent techniques used in the technical analysis field: wavelets and the empirical mode decomposition in financial time series. The book also discusses the theory to test the performance of the indicators and introduces the MATLAB Financial Toolbox, some of the functions/codes of which are used in our numerical experiments.
Betaal eenvoudig met kaart, Klarna, Apple Pay of Google Pay. Niet tevreden? Je hebt altijd 14 dagen bedenktijd. Lees meer in onze voorwaarden. Heb je vragen, mail ons dan via hello@memmo.org.
Memmo maakt studeren makkelijker – waar je ook bent ter wereld. Wij brengen je cursusboeken en slimme studietools samen op één plek: samenvattingen, quizzen, podcasts en flashcards. En Ted, je studievriend die antwoord geeft op alles wat je je afvraagt. Meer dan 50.000 studenten studeren hier al – gebouwd om je sneller te laten leren en minder stress te geven.
Misschien vind je dit ook leuk
Koop het boek0