
See How Graphics Reveal Information
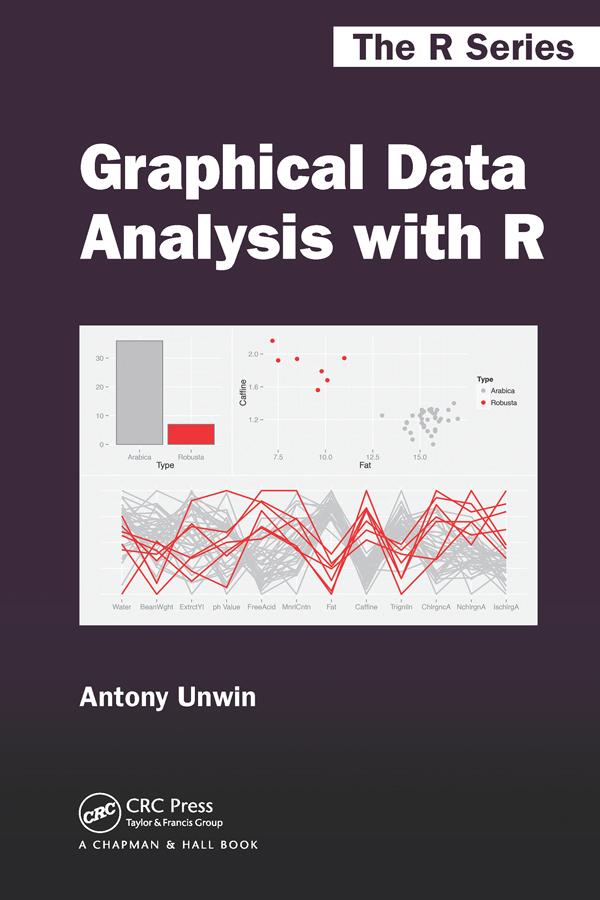
Graphical Data Analysis with R shows you what information you can gain from graphical displays. The book focuses on why you draw graphics to display data and which graphics to draw (and uses R to do so). All the datasets are available in R or one of its packages and the R code is available at rosuda.org/GDA.
Graphical data analysis is useful for data cleaning, exploring data structure, detecting outliers and unusual groups, identifying trends and clusters, spotting local patterns, evaluating modelling output, and presenting results. This book guides you in choosing graphics and understanding what information you can glean from them. It can be used as a primary text in a graphical data analysis course or as a supplement in a statistics course. Colour graphics are used throughout.
Betaal eenvoudig met kaart, Klarna, Apple Pay of Google Pay. Niet tevreden? Je hebt altijd 14 dagen bedenktijd. Lees meer in onze voorwaarden. Heb je vragen, mail ons dan via hello@memmo.org.
Memmo maakt studeren makkelijker – waar je ook bent ter wereld. Wij brengen je cursusboeken en slimme studietools samen op één plek: samenvattingen, quizzen, podcasts en flashcards. En Ted, je studievriend die antwoord geeft op alles wat je je afvraagt. Meer dan 50.000 studenten studeren hier al – gebouwd om je sneller te laten leren en minder stress te geven.