
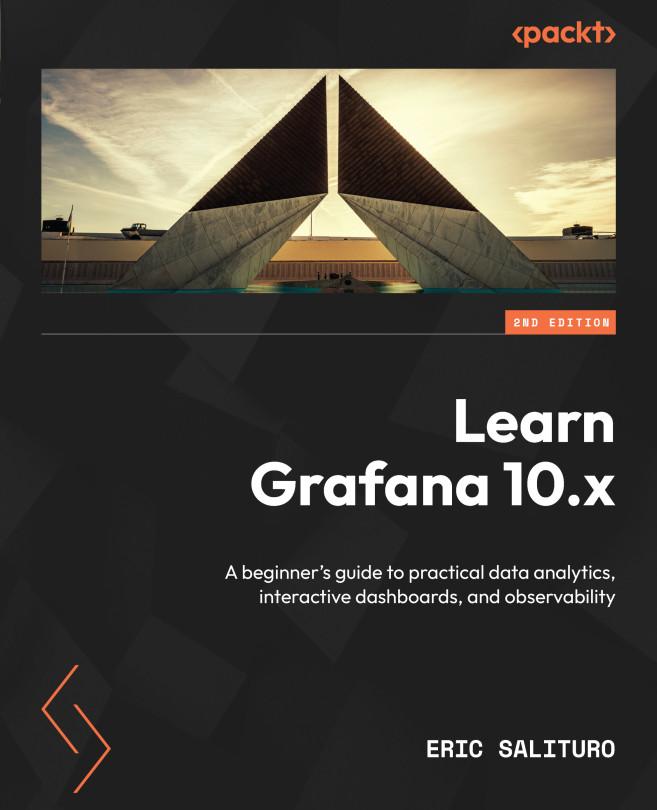
Get ready to unlock the full potential of the open-source Grafana observability platform, ideal for analyzing and monitoring time-series data with this updated second edition. This beginners guide will help you get up to speed with Grafana’s latest features for querying, visualizing, and exploring logs and metrics, no matter where they are stored.
Starting with the basics, this book demonstrates how to quickly install and set up a Grafana server using Docker. You’ll then be introduced to the main components of the Grafana interface before learning how to analyze and visualize data from sources such as InfluxDB, Telegraf, Prometheus, Logstash, and Elasticsearch. The book extensively covers key panel visualizations in Grafana, including Time Series, Stat, Table, Bar Gauge, and Text, and guides you in using Python to pipeline data, transformations to facilitate analytics, and templating to build dynamic dashboards. Exploring real-time data streaming with Telegraf, Promtail, and Loki, you’ll work with observability features like alerting rules and integration with PagerDuty and Slack. As you progress, the book addresses the administrative aspects of Grafana, from configuring users and organizations to implementing user authentication with Okta and LDAP, as well as organizing dashboards into folders, and more.
By the end of this book, you’ll have gained all the knowledge you need to start building interactive dashboards.
Payez facilement par carte, Klarna, Apple Pay ou Google Pay. Pas satisfait ? Vous avez toujours une garantie de remboursement de 14 jours. En savoir plus dans nos conditions. Si vous avez des questions, envoyez-nous un e-mail à hello@memmo.org.
Memmo facilite tes études, où que tu sois dans le monde. On rassemble tes manuels de cours et des outils d'étude intelligents au même endroit : résumés, quiz, podcasts et flashcards. Et il y a Ted, ton compagnon d'étude qui répond à toutes tes questions. Plus de 50 000 étudiants étudient déjà ici – conçu pour t'aider à apprendre plus vite et à moins stresser.