
See How Graphics Reveal Information
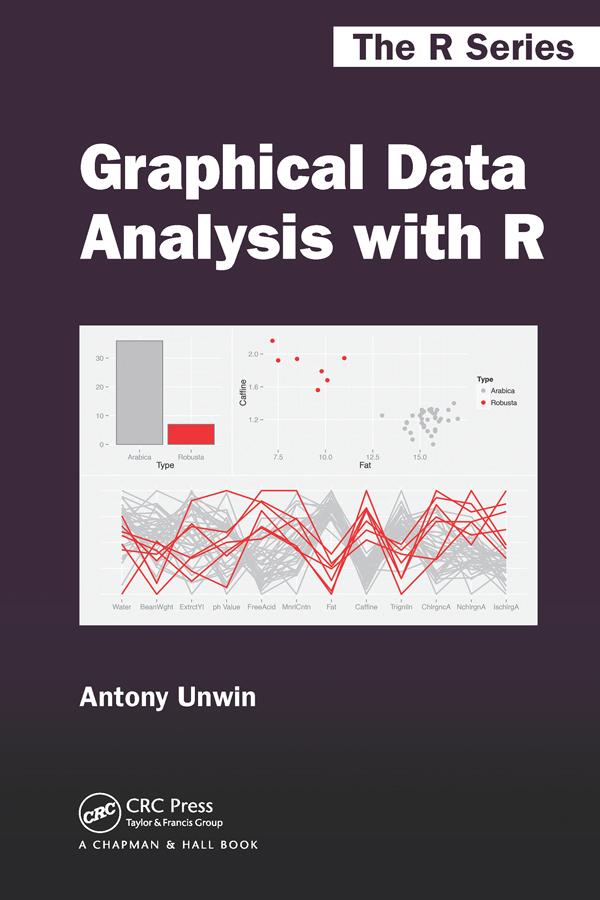
Graphical Data Analysis with R shows you what information you can gain from graphical displays. The book focuses on why you draw graphics to display data and which graphics to draw (and uses R to do so). All the datasets are available in R or one of its packages and the R code is available at rosuda.org/GDA.
Graphical data analysis is useful for data cleaning, exploring data structure, detecting outliers and unusual groups, identifying trends and clusters, spotting local patterns, evaluating modelling output, and presenting results. This book guides you in choosing graphics and understanding what information you can glean from them. It can be used as a primary text in a graphical data analysis course or as a supplement in a statistics course. Colour graphics are used throughout.
Payez facilement par carte, Klarna, Apple Pay ou Google Pay. Pas satisfait ? Vous avez toujours une garantie de remboursement de 14 jours. En savoir plus dans nos conditions. Si vous avez des questions, envoyez-nous un e-mail à hello@memmo.org.
Memmo facilite tes études, où que tu sois dans le monde. On rassemble tes manuels de cours et des outils d'étude intelligents au même endroit : résumés, quiz, podcasts et flashcards. Et il y a Ted, ton compagnon d'étude qui répond à toutes tes questions. Plus de 50 000 étudiants étudient déjà ici – conçu pour t'aider à apprendre plus vite et à moins stresser.