
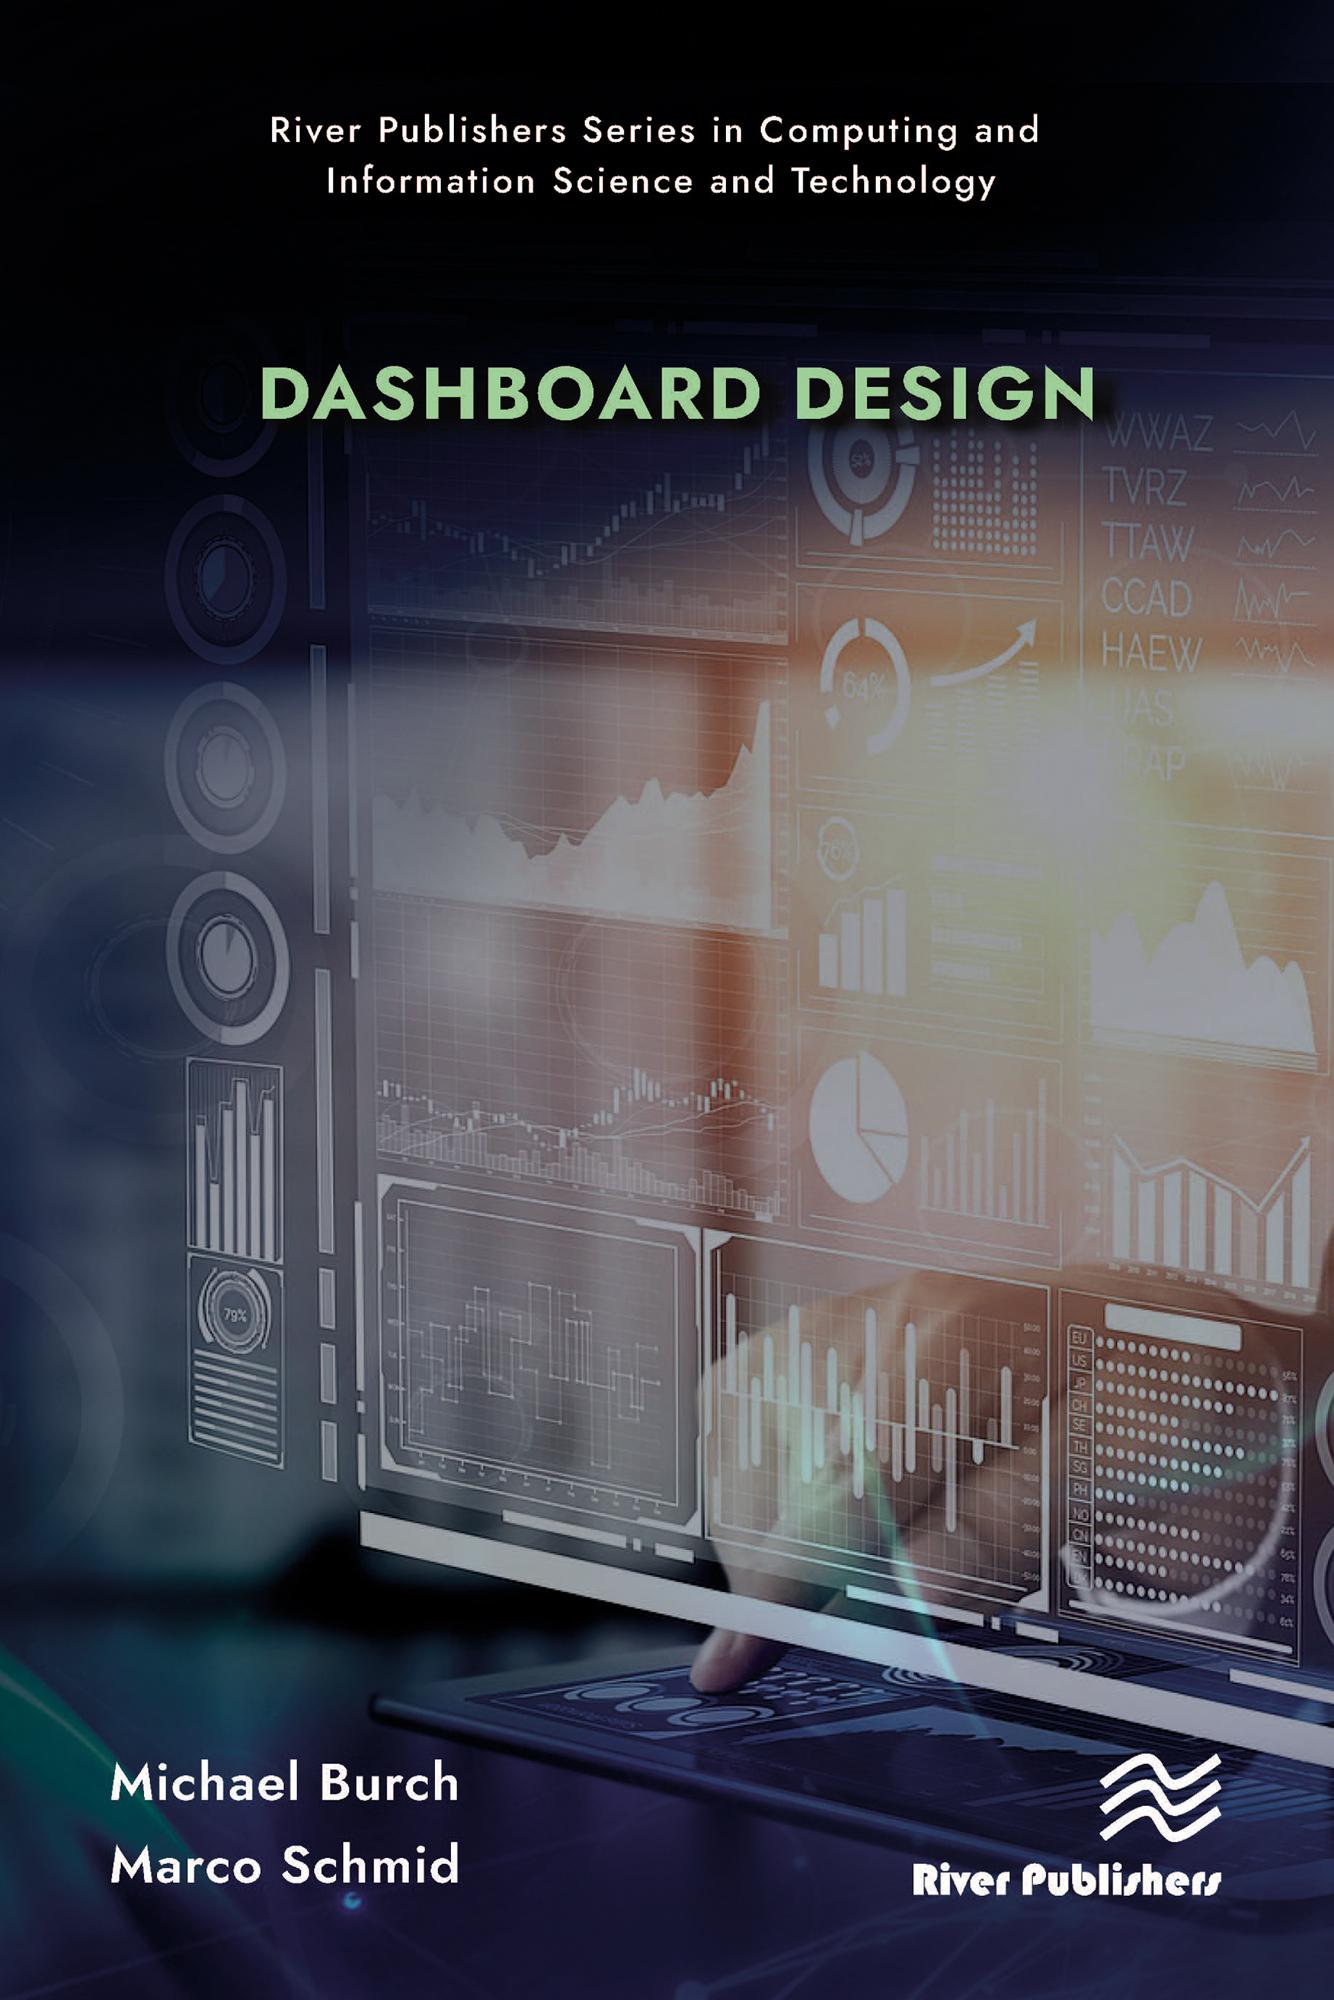
Interactive visualization and visual analytics tools have been designed and developed in the past and will be developed in the future as well. In each application domain in which data is measured, generated, and recorded we see a potential candidate for an interactive visualization tool with the goal to find insights and knowledge in the data. This knowledge can be found either visually by humans’ interventions or algorithmically by the machine, in the best case by applying both concepts in combination as in visual analytics. One of the easiest ways to get an interactive visualization tool running is by means of dashboards, typically implemented as webpages that can run in a web browser and are accessible online, creating some kind of web-based solution.
This book describes ways to design and implement dashboards based on the programming language Python, the graphics library Plotly, and Dash. The readers can use the provided dashboard codes as a starting point and extend the functionality and features on their desire.
Technical topics discussed in the book include:
- Design in visualization
- Interaction principles in information visualization
- User interface design
- Linking Python, Dash, and Plotly
- Coding in Python
- Dashboard examples with Python code.
Payez facilement par carte, Klarna, Apple Pay ou Google Pay. Pas satisfait ? Vous avez toujours une garantie de remboursement de 14 jours. En savoir plus dans nos conditions. Si vous avez des questions, envoyez-nous un e-mail à hello@memmo.org.
Memmo facilite tes études, où que tu sois dans le monde. On rassemble tes manuels de cours et des outils d'étude intelligents au même endroit : résumés, quiz, podcasts et flashcards. Et il y a Ted, ton compagnon d'étude qui répond à toutes tes questions. Plus de 50 000 étudiants étudient déjà ici – conçu pour t'aider à apprendre plus vite et à moins stresser.