
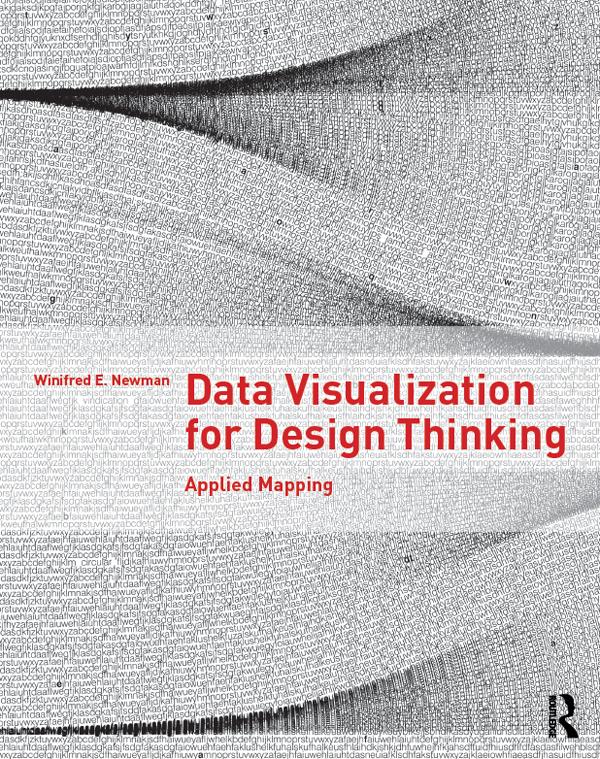
Data Visualization for Design Thinking helps you make better maps. Treating maps as applied research, you’ll be able to understand how to map sites, places, ideas, and projects, revealing the complex relationships between what you represent, your thinking, the technology you use, the culture you belong to, and your aesthetic practices. More than 100 examples illustrated with over 200 color images show you how to visualize data through mapping. Includes five in-depth cases studies and numerous examples throughout.
Maksa helposti kortilla, Klarnalla, Apple Paylla tai Google Paylla. Etkö ole tyytyväinen? Sinulla on aina 14 päivän palautusoikeus. Lue lisää ehdoistamme. Jos sinulla on kysyttävää, lähetä meille sähköpostia osoitteeseen hello@memmo.org.
Memmo tekee opiskelusta helpompaa – missä päin maailmaa ikinä oletkin. Meillä yhdistät kurssikirjat ja fiksut opiskelutyökalut yhteen paikkaan: tiivistelmät, visat, podcastit ja muistikortit. Ja sitten Ted, opiskelukaverisi, joka vastaa kaikkeen, mitä ikinä mietitkin. Yli 50 000 opiskelijaa opiskelee jo täällä – rakennettu auttamaan sinua oppimaan nopeammin ja stressaamaan vähemmän.