
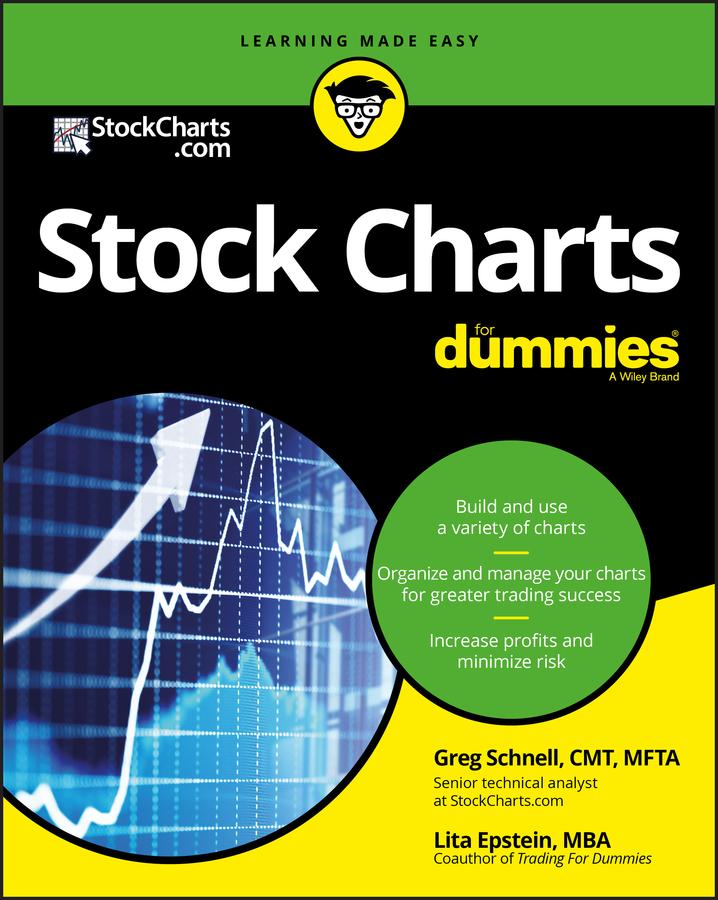
Many trading and technical analysis books focus on how to use charts to make stock trading decisions, but what about how to actually build a chart? Stock Charts For Dummies reveals the important stories charts tell, and how different parameters can impact what you see on the screen. This book will explain some of the most powerful display settings that help traders understand the information in a chart to find outperformance as its beginning.
Stock Charts for Dummies will teach you how to build a visually appealing chart and add tools based on the type of trading or investing decision you're trying to make. It will also introduce you to the pros, cons, and best practices of using three key types of charts: Candlesticks, Bar Charts, and Line Charts.
- Build and use technical chart patterns
- Increase profits and minimize risk
- Track and identify specific trends within charts
A unique guide for beginning traders and investors, Stock Charts for Dummies will help you make sense of stock charts.
Maksa helposti kortilla, Klarnalla, Apple Paylla tai Google Paylla. Etkö ole tyytyväinen? Sinulla on aina 14 päivän palautusoikeus. Lue lisää ehdoistamme. Jos sinulla on kysyttävää, lähetä meille sähköpostia osoitteeseen hello@memmo.org.
Memmo tekee opiskelusta helpompaa – missä päin maailmaa ikinä oletkin. Meillä yhdistät kurssikirjat ja fiksut opiskelutyökalut yhteen paikkaan: tiivistelmät, visat, podcastit ja muistikortit. Ja sitten Ted, opiskelukaverisi, joka vastaa kaikkeen, mitä ikinä mietitkin. Yli 50 000 opiskelijaa opiskelee jo täällä – rakennettu auttamaan sinua oppimaan nopeammin ja stressaamaan vähemmän.