
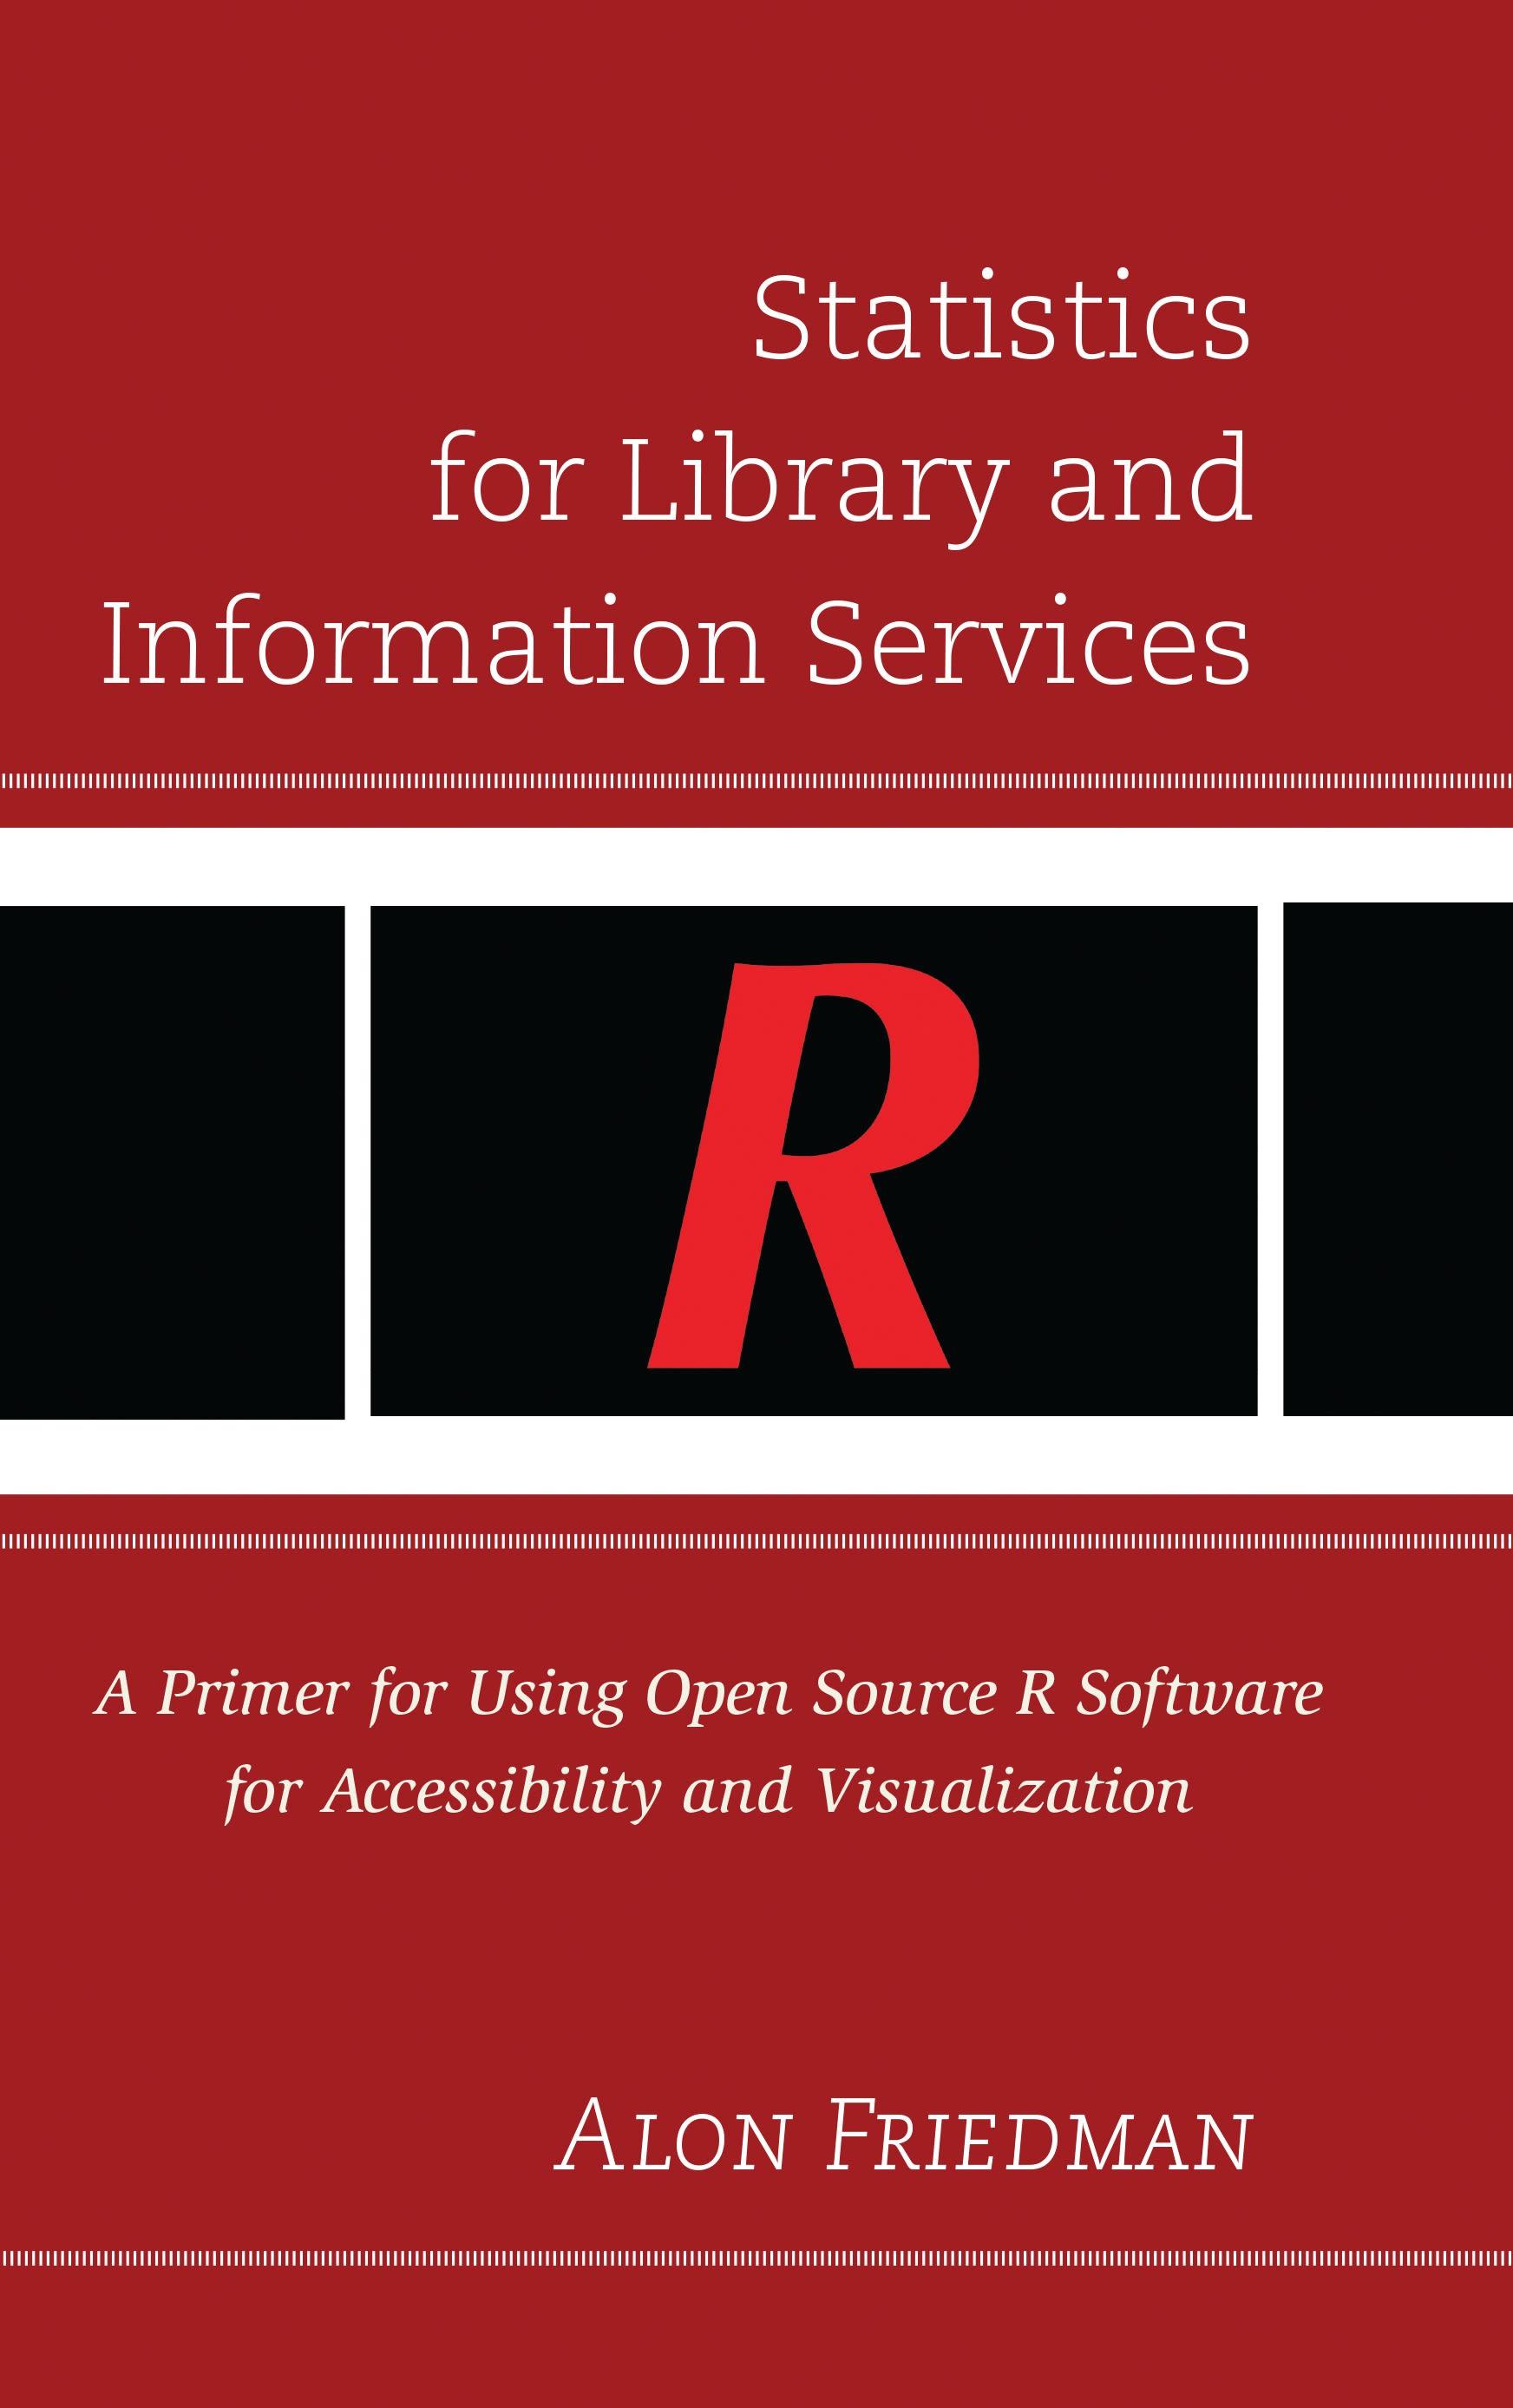
Statistics for Library and Information Services, written for non-statisticians, provides logical, user-friendly, and step-by-step instructions to make statistics more accessible for students and professionals in the field of Information Science. It emphasizes concepts of statistical theory and data collection methodologies, but also extends to the topics of visualization creation and display, so that the reader will be able to better conduct statistical analysis and communicate his/her findings.
The book is tailored for information science students and professionals. It has specific examples of dataset sets, scripts, design modules, data repositories, homework assignments, and a glossary lexicon that matches the field of Information Science. The textbook provides a visual road map that is customized specifically for Information Science instructors, students, and professionals regarding statistics and visualization.
Each chapter in the book includes full-color illustrations on how to use R for the statistical model that particular chapter will cover.
This book is arranged in 17 chapters, which are organized into five main sections:
the first section introduces research design and data collection;the second section discusses basic statistical concepts, including descriptive, bivariate, time series, and regression analyses; section 3 covers the subject of visualization creation using Open Source R; section 4 covers decision making from the analysis; and the last section provides examples and references.
Every chapter illustrates how to use Open Source R and features two subsections for the major ideas of the chapter: its statistical model and its visual representation. The statistical model captures the main statistical formulas/theories covered in each chapter, while the visual representation addresses the subject of the types of visualization that are produced from the statistical analysis model covered in that particular chapter.
Don’t miss the book’s companion Web site at www.statisticsforlis.org
The book is tailored for information science students and professionals. It has specific examples of dataset sets, scripts, design modules, data repositories, homework assignments, and a glossary lexicon that matches the field of Information Science. The textbook provides a visual road map that is customized specifically for Information Science instructors, students, and professionals regarding statistics and visualization.
Each chapter in the book includes full-color illustrations on how to use R for the statistical model that particular chapter will cover.
This book is arranged in 17 chapters, which are organized into five main sections:
the first section introduces research design and data collection;the second section discusses basic statistical concepts, including descriptive, bivariate, time series, and regression analyses; section 3 covers the subject of visualization creation using Open Source R; section 4 covers decision making from the analysis; and the last section provides examples and references.
Every chapter illustrates how to use Open Source R and features two subsections for the major ideas of the chapter: its statistical model and its visual representation. The statistical model captures the main statistical formulas/theories covered in each chapter, while the visual representation addresses the subject of the types of visualization that are produced from the statistical analysis model covered in that particular chapter.
Don’t miss the book’s companion Web site at www.statisticsforlis.org
Paga fácilmente con tarjeta, Klarna, Apple Pay o Google Pay. ¿No estás contento? Siempre tienes 14 días de garantía de devolución. Lee más en nuestros términos. Si tienes preguntas, escríbenos a hello@memmo.org.
Memmo hace que estudiar sea más fácil, estés donde estés. Aquí tienes tus libros de texto y herramientas de estudio inteligentes en un solo lugar: resúmenes, quizzes, podcasts y flashcards. Y también a Ted, tu compañero de estudio que responde a todo lo que te preguntes. Más de 50 000 estudiantes ya estudian aquí. Está hecho para que aprendas más rápido y te estreses menos.