
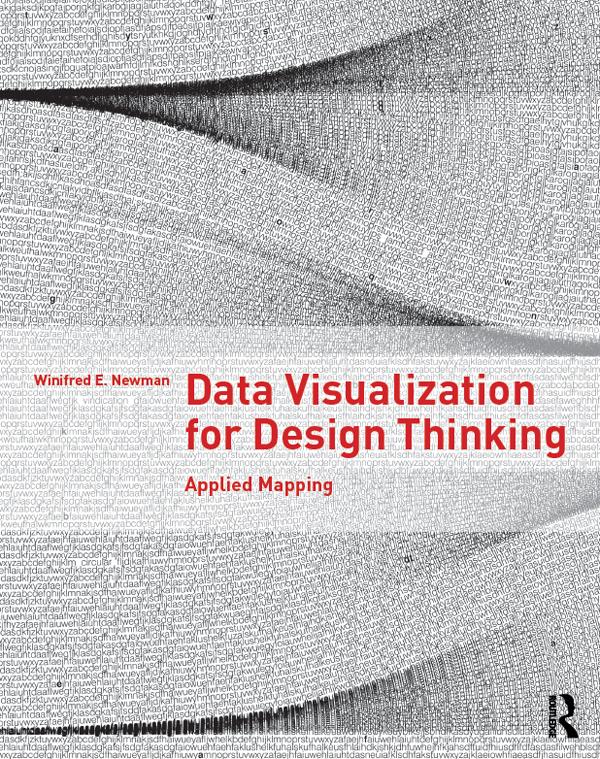
Data Visualization for Design Thinking helps you make better maps. Treating maps as applied research, you’ll be able to understand how to map sites, places, ideas, and projects, revealing the complex relationships between what you represent, your thinking, the technology you use, the culture you belong to, and your aesthetic practices. More than 100 examples illustrated with over 200 color images show you how to visualize data through mapping. Includes five in-depth cases studies and numerous examples throughout.
Paga fácilmente con tarjeta, Klarna, Apple Pay o Google Pay. ¿No estás contento? Siempre tienes 14 días de garantía de devolución. Lee más en nuestros términos. Si tienes preguntas, escríbenos a hello@memmo.org.
Memmo hace que estudiar sea más fácil, estés donde estés. Aquí tienes tus libros de texto y herramientas de estudio inteligentes en un solo lugar: resúmenes, quizzes, podcasts y flashcards. Y también a Ted, tu compañero de estudio que responde a todo lo que te preguntes. Más de 50 000 estudiantes ya estudian aquí. Está hecho para que aprendas más rápido y te estreses menos.