
See How Graphics Reveal Information
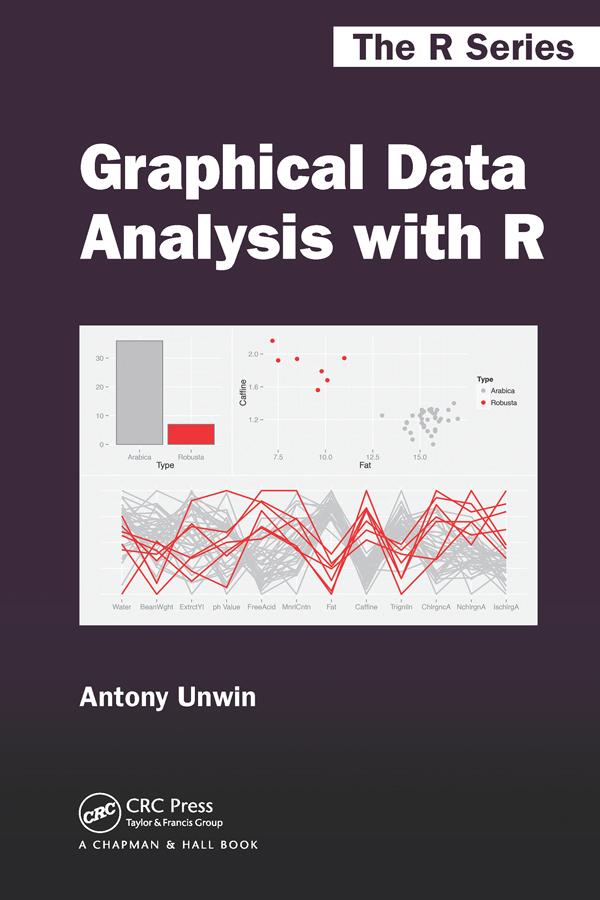
Graphical Data Analysis with R shows you what information you can gain from graphical displays. The book focuses on why you draw graphics to display data and which graphics to draw (and uses R to do so). All the datasets are available in R or one of its packages and the R code is available at rosuda.org/GDA.
Graphical data analysis is useful for data cleaning, exploring data structure, detecting outliers and unusual groups, identifying trends and clusters, spotting local patterns, evaluating modelling output, and presenting results. This book guides you in choosing graphics and understanding what information you can glean from them. It can be used as a primary text in a graphical data analysis course or as a supplement in a statistics course. Colour graphics are used throughout.
Paga fácilmente con tarjeta, Klarna, Apple Pay o Google Pay. ¿No estás contento? Siempre tienes 14 días de garantía de devolución. Lee más en nuestros términos. Si tienes preguntas, escríbenos a hello@memmo.org.
Memmo hace que estudiar sea más fácil, estés donde estés. Aquí tienes tus libros de texto y herramientas de estudio inteligentes en un solo lugar: resúmenes, quizzes, podcasts y flashcards. Y también a Ted, tu compañero de estudio que responde a todo lo que te preguntes. Más de 50 000 estudiantes ya estudian aquí. Está hecho para que aprendas más rápido y te estreses menos.