
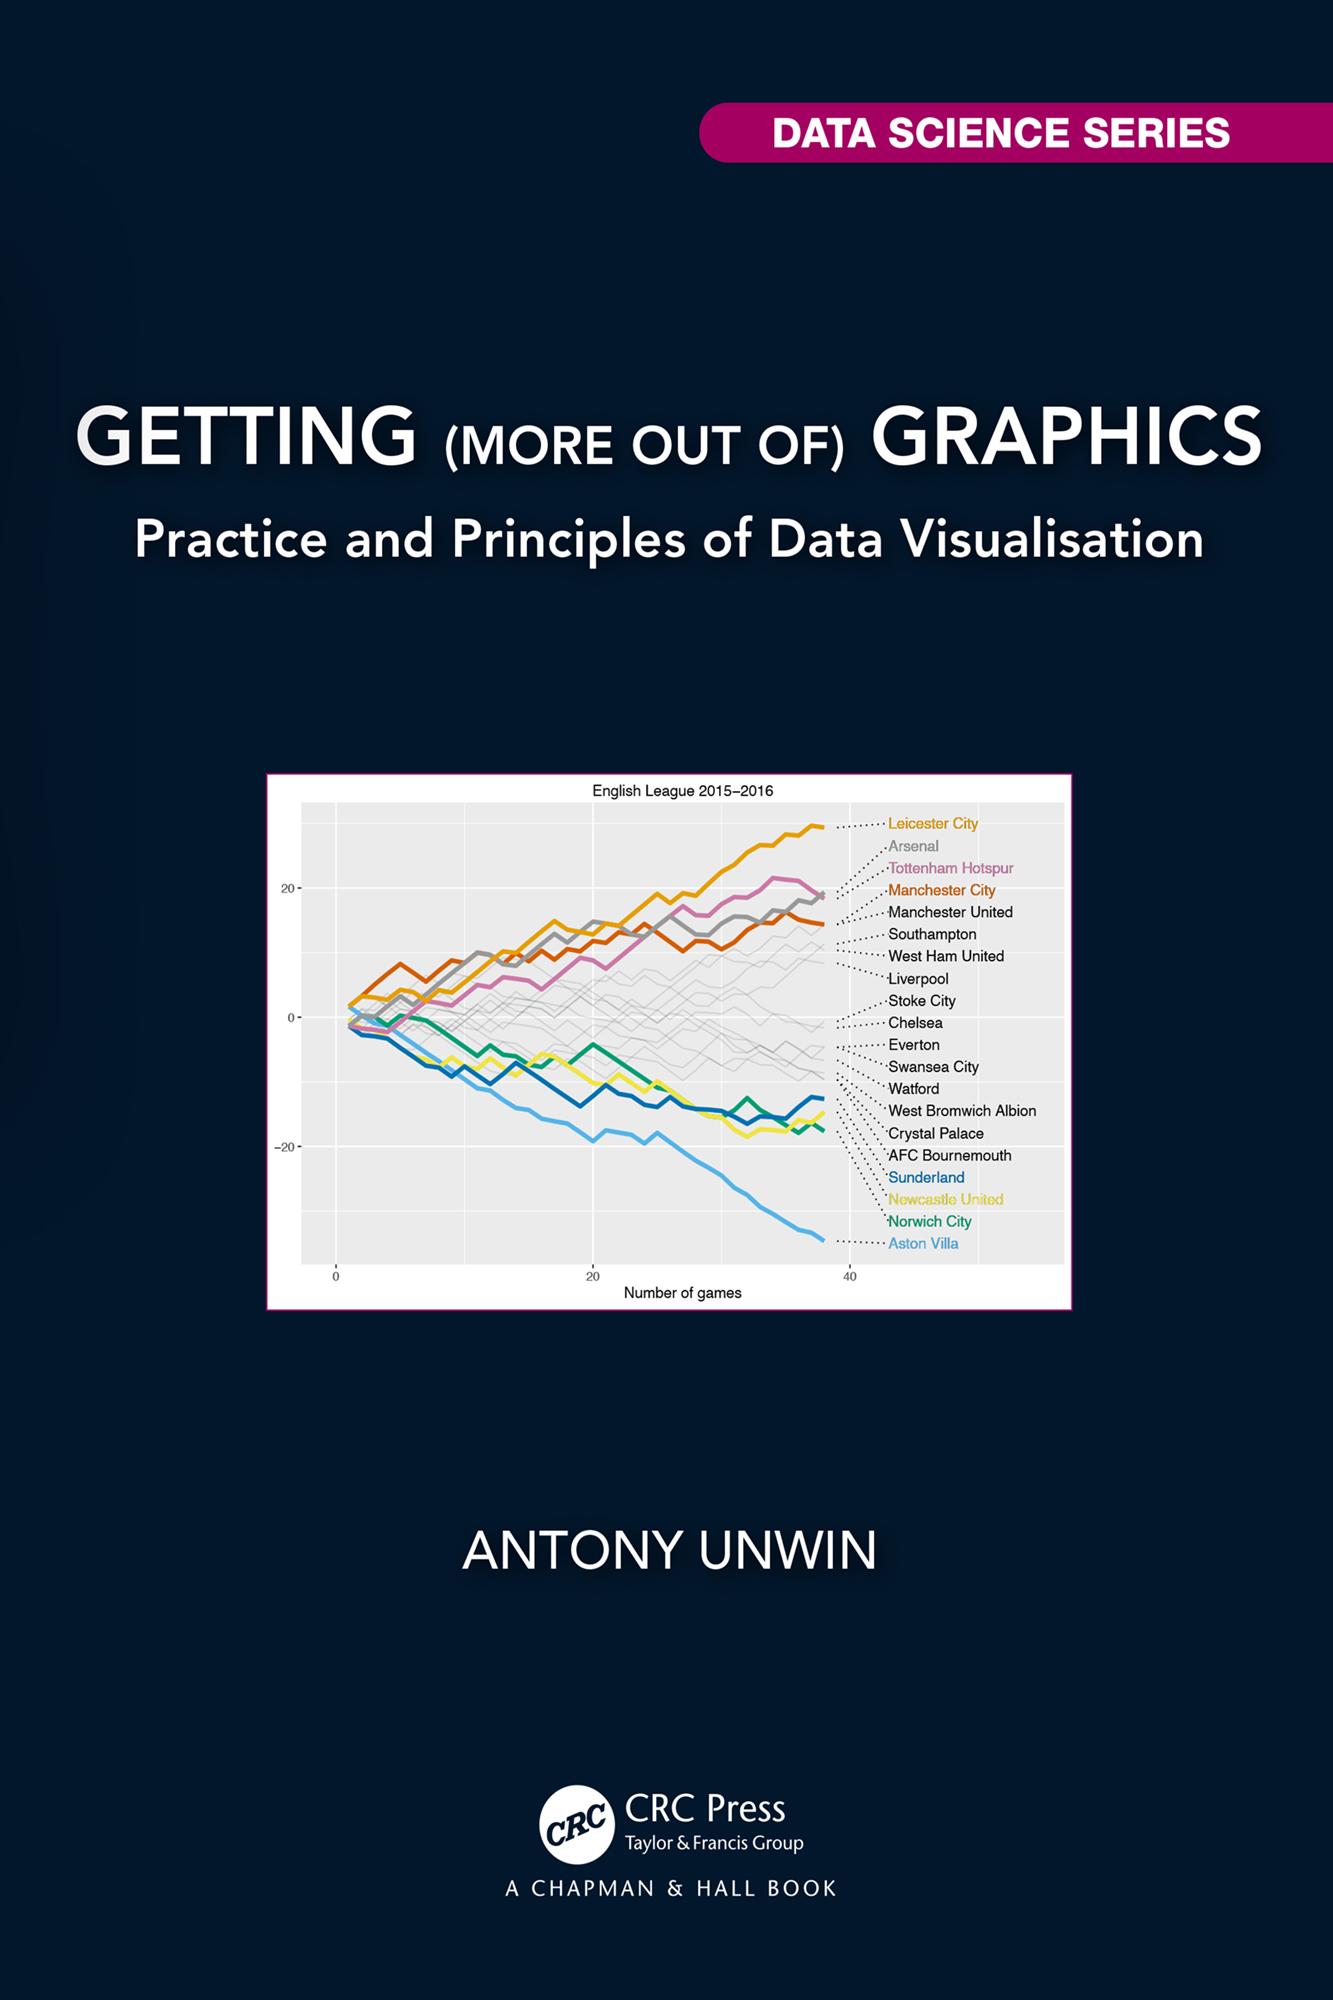
Data graphics are used extensively to present information. Understanding graphics is a lot about understanding the data represented by the graphics, having a feel not just for the numbers themselves, the reliability and uncertainty associated with them, but also for what they mean. This book presents a practical approach to data visualisation with real applications front and centre.
The first part of the book is a series of case studies, each describing a graphical analysis of a real dataset. The second part pulls together ideas from the case studies and provides an overview of the main factors affecting understanding graphics.
Key Features:
- Explains how to get insights from graphics.
- Emphasises the value of drawing many graphics.
- Underlines the importance for analysis of background knowledge and context.
Readers may be data scientists, statisticians or people who want to become more visually literate. A knowledge of Statistics is not required, just an interest in data graphics and some experience of working with data. It will help if the reader knows something of basic graphic forms such as barcharts, histograms, and scatterplots.
Paga fácilmente con tarjeta, Klarna, Apple Pay o Google Pay. ¿No estás contento? Siempre tienes 14 días de garantía de devolución. Lee más en nuestros términos. Si tienes preguntas, escríbenos a hello@memmo.org.
Memmo hace que estudiar sea más fácil, estés donde estés. Aquí tienes tus libros de texto y herramientas de estudio inteligentes en un solo lugar: resúmenes, quizzes, podcasts y flashcards. Y también a Ted, tu compañero de estudio que responde a todo lo que te preguntes. Más de 50 000 estudiantes ya estudian aquí. Está hecho para que aprendas más rápido y te estreses menos.