
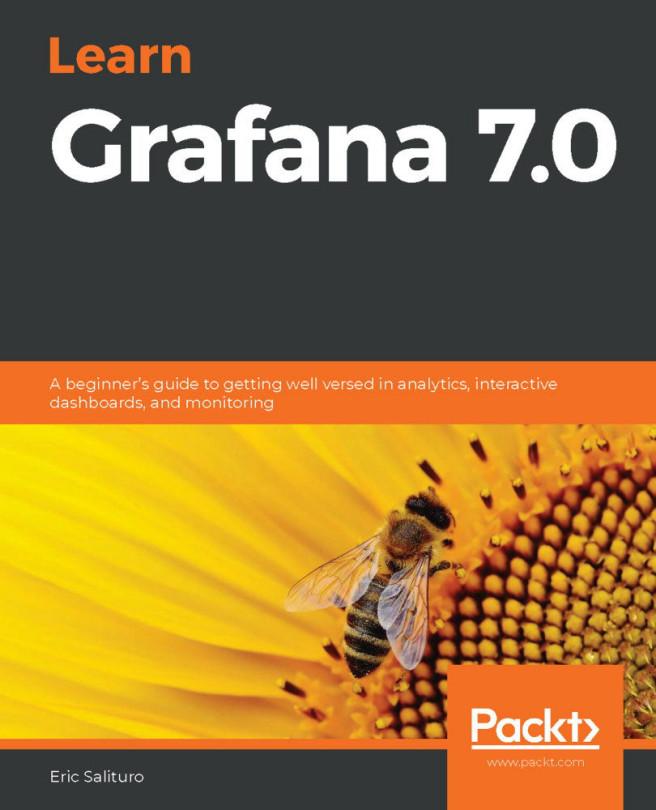
Grafana is an open-source analytical platform used to analyze and monitoring time-series data. This beginner's guide will help you get to grips with Grafana's new features for querying, visualizing, and exploring metrics and logs no matter where they are stored.
The book begins by showing you how to install and set up the Grafana server. You'll explore the working mechanism of various components of the Grafana interface along with its security features, and learn how to visualize and monitor data using, InfluxDB, Prometheus, Logstash, and Elasticsearch. This Grafana book covers the advanced features of the Graph panel and shows you how Stat, Table, Bar Gauge, and Text are used. You'll build dynamic dashboards to perform end-to-end analytics and label and organize dashboards into folders to make them easier to find. As you progress, the book delves into the administrative aspects of Grafana by creating alerts, setting permissions for teams, and implementing user authentication. Along with exploring Grafana's multi-cloud monitoring support, you'll also learn about Grafana Loki, which is a backend logger for users running Prometheus and Kubernetes.
By the end of this book, you'll have gained all the knowledge you need to start building interactive dashboards.
Płać wygodnie kartą, Klarną, Apple Pay lub Google Pay. Nie jesteś zadowolony? Zawsze masz 14-dniową gwarancję zwrotu pieniędzy. Więcej przeczytasz w naszych warunkach. Masz pytania? Napisz do nas na hello@memmo.org.
Memmo ułatwia naukę – gdziekolwiek jesteś na świecie. U nas znajdziesz podręczniki i sprytne narzędzia do nauki w jednym miejscu: streszczenia, quizy, podcasty i fiszki. A do tego Ted, Twój kumpel do nauki, który odpowie na wszystko, co Cię nurtuje. Ponad 50 000 studentów już tu się uczy – stworzone, byś uczył się szybciej i mniej stresował.