
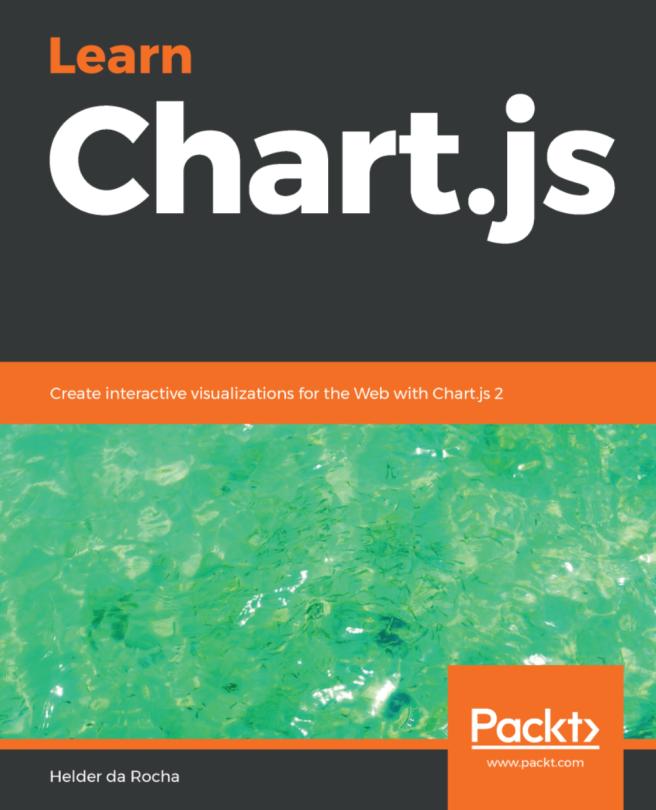
Chart.js is a free, open-source data visualization library, maintained by an active community of developers in GitHub, where it rates as the second most popular data visualization library. If you want to quickly create responsive Web-based data visualizations for the Web, Chart.js is a great choice.
This book guides the reader through dozens of practical examples, complete with code you can run and modify as you wish. It is a practical hands-on introduction to Chart.js. If you have basic knowledge of HTML, CSS and JavaScript you can learn to create beautiful interactive Web Canvas-based visualizations for your data using Chart.js. This book will help you set up Chart.js in a Web page and show how to create each one of the eight Chart.js chart types. You will also learn how to configure most properties that override Chart’s default styles and behaviors. Practical applications of Chart.js are exemplified using real data files obtained from public data portals. You will learn how to load, parse, filter and select the data you wish to display from those files. You will also learn how to create visualizations that reveal patterns in the data. This book is based on Chart.js version 2.7.3 and ES2015 JavaScript.
By the end of the book, you will be able to create beautiful, efficient and interactive data visualizations for the Web using Chart.js.
Płać wygodnie kartą, Klarną, Apple Pay lub Google Pay. Nie jesteś zadowolony? Zawsze masz 14-dniową gwarancję zwrotu pieniędzy. Więcej przeczytasz w naszych warunkach. Masz pytania? Napisz do nas na hello@memmo.org.
Memmo ułatwia naukę – gdziekolwiek jesteś na świecie. U nas znajdziesz podręczniki i sprytne narzędzia do nauki w jednym miejscu: streszczenia, quizy, podcasty i fiszki. A do tego Ted, Twój kumpel do nauki, który odpowie na wszystko, co Cię nurtuje. Ponad 50 000 studentów już tu się uczy – stworzone, byś uczył się szybciej i mniej stresował.