
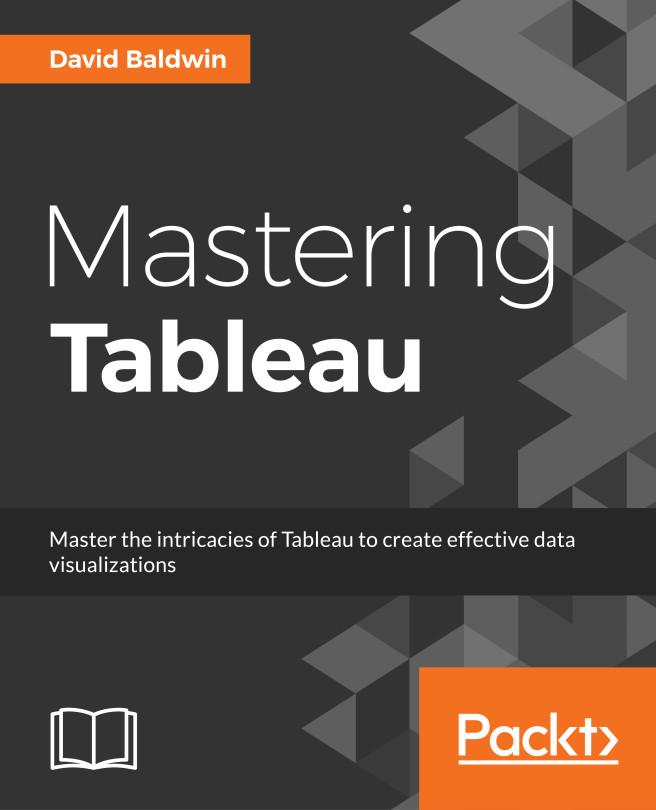
Tableau has emerged as one of the most popular Business Intelligence solutions in recent times, thanks to its powerful and interactive data visualization capabilities. This book will empower you to become a master in Tableau by exploiting the many new features introduced in Tableau 10.0.
You will embark on this exciting journey by getting to know the valuable methods of utilizing advanced calculations to solve complex problems. These techniques include creative use of different types of calculations such as row-level, aggregate-level, and more. You will discover how almost any data visualization challenge can be met in Tableau by getting a proper understanding of the tool’s inner workings and creatively exploring possibilities.
You’ll be armed with an arsenal of advanced chart types and techniques to enable you to efficiently and engagingly present information to a variety of audiences through the use of clear, efficient, and engaging dashboards. Explanations and examples of efficient and inefficient visualization techniques, well-designed and poorly designed dashboards, and compromise options when Tableau consumers will not embrace data visualization will build on your understanding of Tableau and how to use it efficiently.
By the end of the book, you will be equipped with all the information you need to create effective dashboards and data visualization solutions using Tableau.
Płać wygodnie kartą, Klarną, Apple Pay lub Google Pay. Nie jesteś zadowolony? Zawsze masz 14-dniową gwarancję zwrotu pieniędzy. Więcej przeczytasz w naszych warunkach. Masz pytania? Napisz do nas na hello@memmo.org.
Memmo ułatwia naukę – gdziekolwiek jesteś na świecie. U nas znajdziesz podręczniki i sprytne narzędzia do nauki w jednym miejscu: streszczenia, quizy, podcasty i fiszki. A do tego Ted, Twój kumpel do nauki, który odpowie na wszystko, co Cię nurtuje. Ponad 50 000 studentów już tu się uczy – stworzone, byś uczył się szybciej i mniej stresował.