
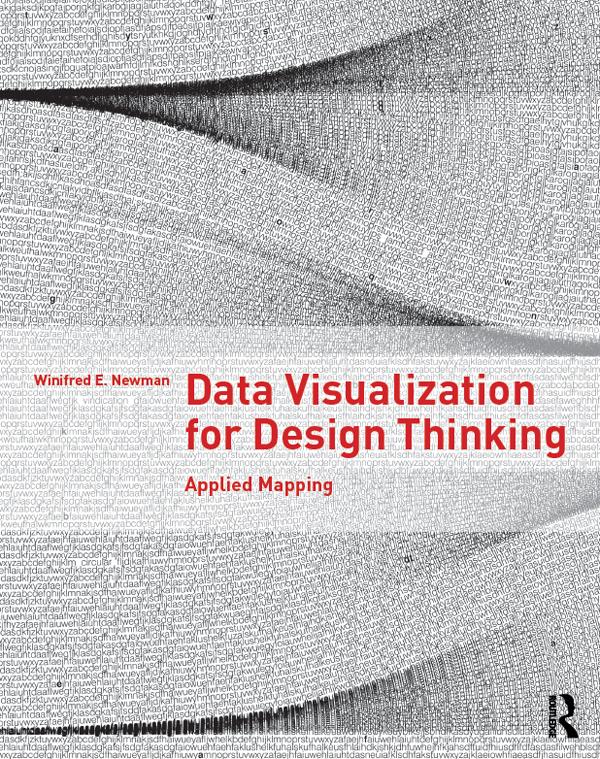
Data Visualization for Design Thinking helps you make better maps. Treating maps as applied research, you’ll be able to understand how to map sites, places, ideas, and projects, revealing the complex relationships between what you represent, your thinking, the technology you use, the culture you belong to, and your aesthetic practices. More than 100 examples illustrated with over 200 color images show you how to visualize data through mapping. Includes five in-depth cases studies and numerous examples throughout.
Płać wygodnie kartą, Klarną, Apple Pay lub Google Pay. Nie jesteś zadowolony? Zawsze masz 14-dniową gwarancję zwrotu pieniędzy. Więcej przeczytasz w naszych warunkach. Masz pytania? Napisz do nas na hello@memmo.org.
Memmo ułatwia naukę – gdziekolwiek jesteś na świecie. U nas znajdziesz podręczniki i sprytne narzędzia do nauki w jednym miejscu: streszczenia, quizy, podcasty i fiszki. A do tego Ted, Twój kumpel do nauki, który odpowie na wszystko, co Cię nurtuje. Ponad 50 000 studentów już tu się uczy – stworzone, byś uczył się szybciej i mniej stresował.