
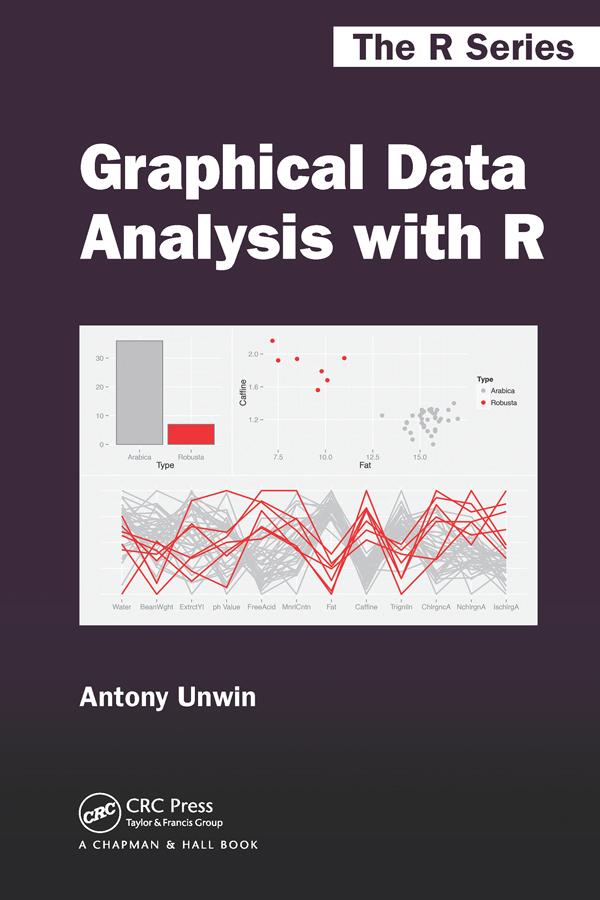
See How Graphics Reveal Information
Graphical Data Analysis with R shows you what information you can gain from graphical displays. The book focuses on why you draw graphics to display data and which graphics to draw (and uses R to do so). All the datasets are available in R or one of its packages and the R code is available at rosuda.org/GDA.
Graphical data analysis is useful for data cleaning, exploring data structure, detecting outliers and unusual groups, identifying trends and clusters, spotting local patterns, evaluating modelling output, and presenting results. This book guides you in choosing graphics and understanding what information you can glean from them. It can be used as a primary text in a graphical data analysis course or as a supplement in a statistics course. Colour graphics are used throughout.
Płać wygodnie kartą, Klarną, Apple Pay lub Google Pay. Nie jesteś zadowolony? Zawsze masz 14-dniową gwarancję zwrotu pieniędzy. Więcej przeczytasz w naszych warunkach. Masz pytania? Napisz do nas na hello@memmo.org.
Memmo ułatwia naukę – gdziekolwiek jesteś na świecie. U nas znajdziesz podręczniki i sprytne narzędzia do nauki w jednym miejscu: streszczenia, quizy, podcasty i fiszki. A do tego Ted, Twój kumpel do nauki, który odpowie na wszystko, co Cię nurtuje. Ponad 50 000 studentów już tu się uczy – stworzone, byś uczył się szybciej i mniej stresował.