
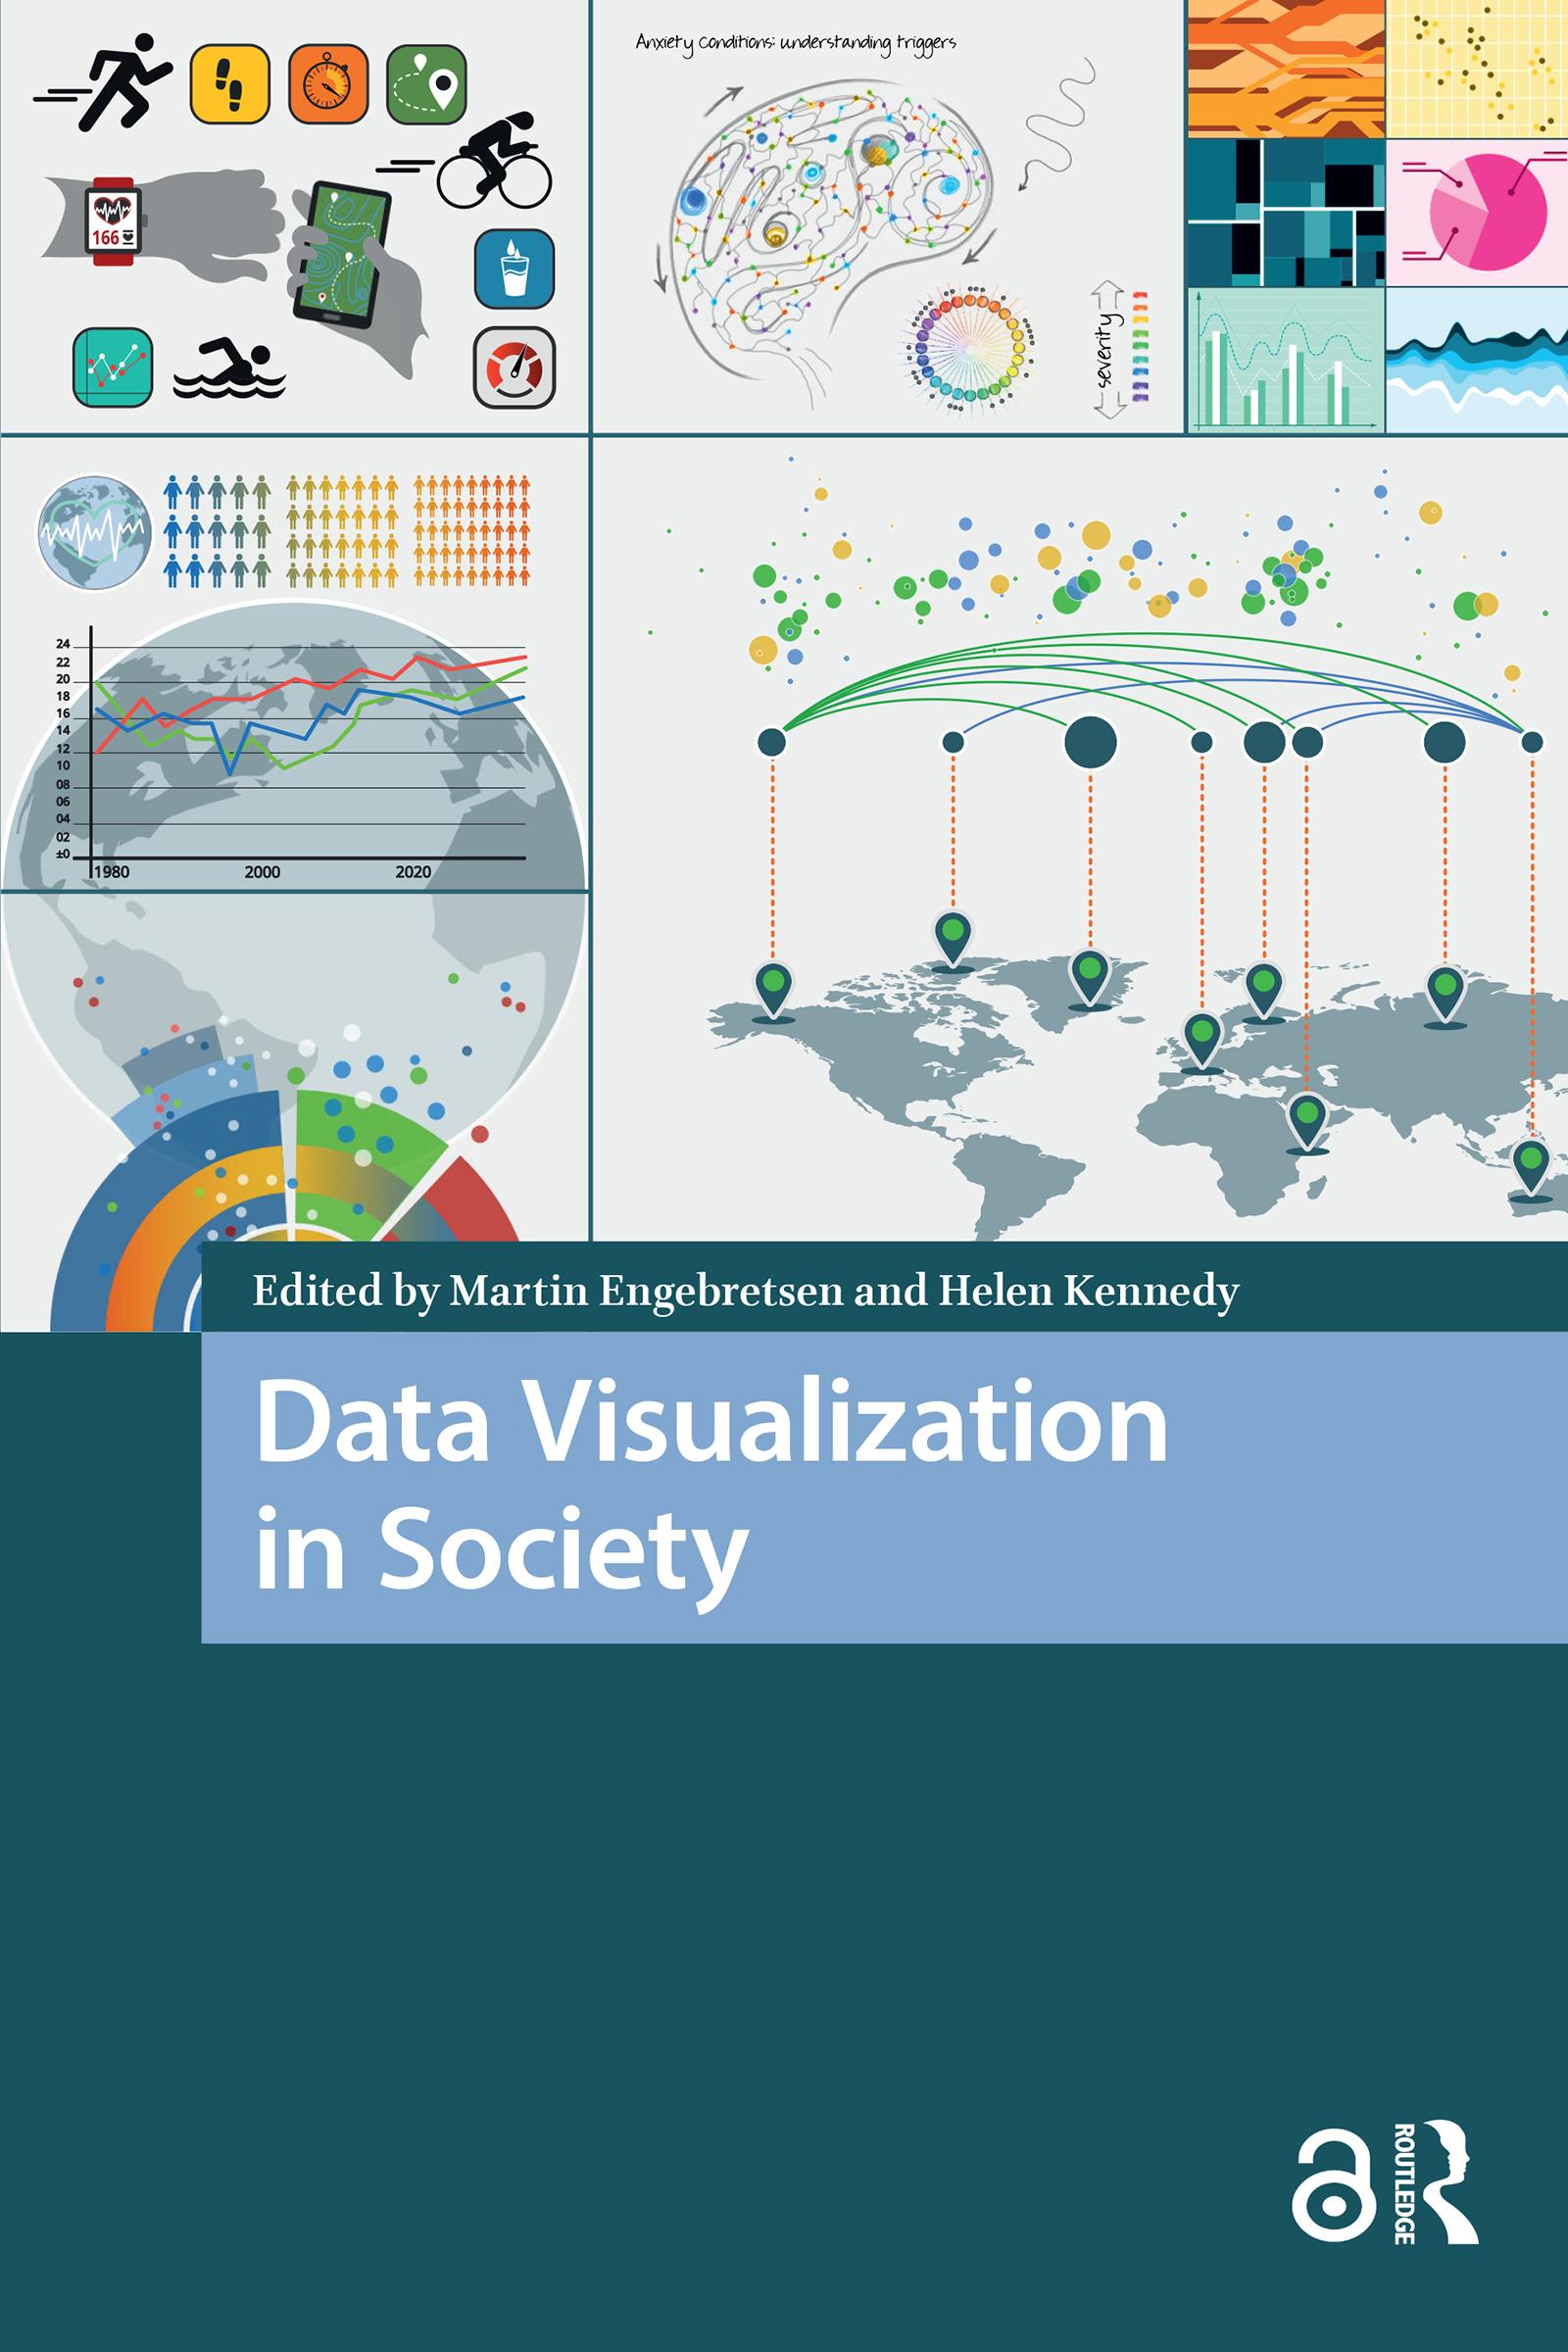
Today we are witnessing an increased use of data visualization in society. Across domains such as work, education and the news, various forms of graphs, charts and maps are used to explain, convince and tell stories. In an era in which more and more data are produced and circulated digitally, and digital tools make visualization production increasingly accessible, it is important to study the conditions under which such visual texts are generated, disseminated and thought to be of societal benefit. This book is a contribution to the multi-disciplined and multi-faceted conversation concerning the forms, uses and roles of data visualization in society. Do data visualizations do 'good' or 'bad'? Do they promote understanding and engagement, or do they do ideological work, privileging certain views of the world over others? The contributions in the book engage with these core questions from a range of disciplinary perspectives.
Strony: 464
Kategoria: Samhällsvetenskap
e-ISBN: 9781040789933
Waga przesyłki: 1.2 kg
Wysyłka w ciągu: 1-2 dni
Płać wygodnie kartą, Klarną, Apple Pay lub Google Pay. Nie jesteś zadowolony? Zawsze masz 14-dniową gwarancję zwrotu pieniędzy. Więcej przeczytasz w naszych warunkach. Masz pytania? Napisz do nas na hello@memmo.org.
Memmo ułatwia naukę – gdziekolwiek jesteś na świecie. U nas znajdziesz podręczniki i sprytne narzędzia do nauki w jednym miejscu: streszczenia, quizy, podcasty i fiszki. A do tego Ted, Twój kumpel do nauki, który odpowie na wszystko, co Cię nurtuje. Ponad 50 000 studentów już tu się uczy – stworzone, byś uczył się szybciej i mniej stresował.
Może Ci się spodobać
Kup książkę0