
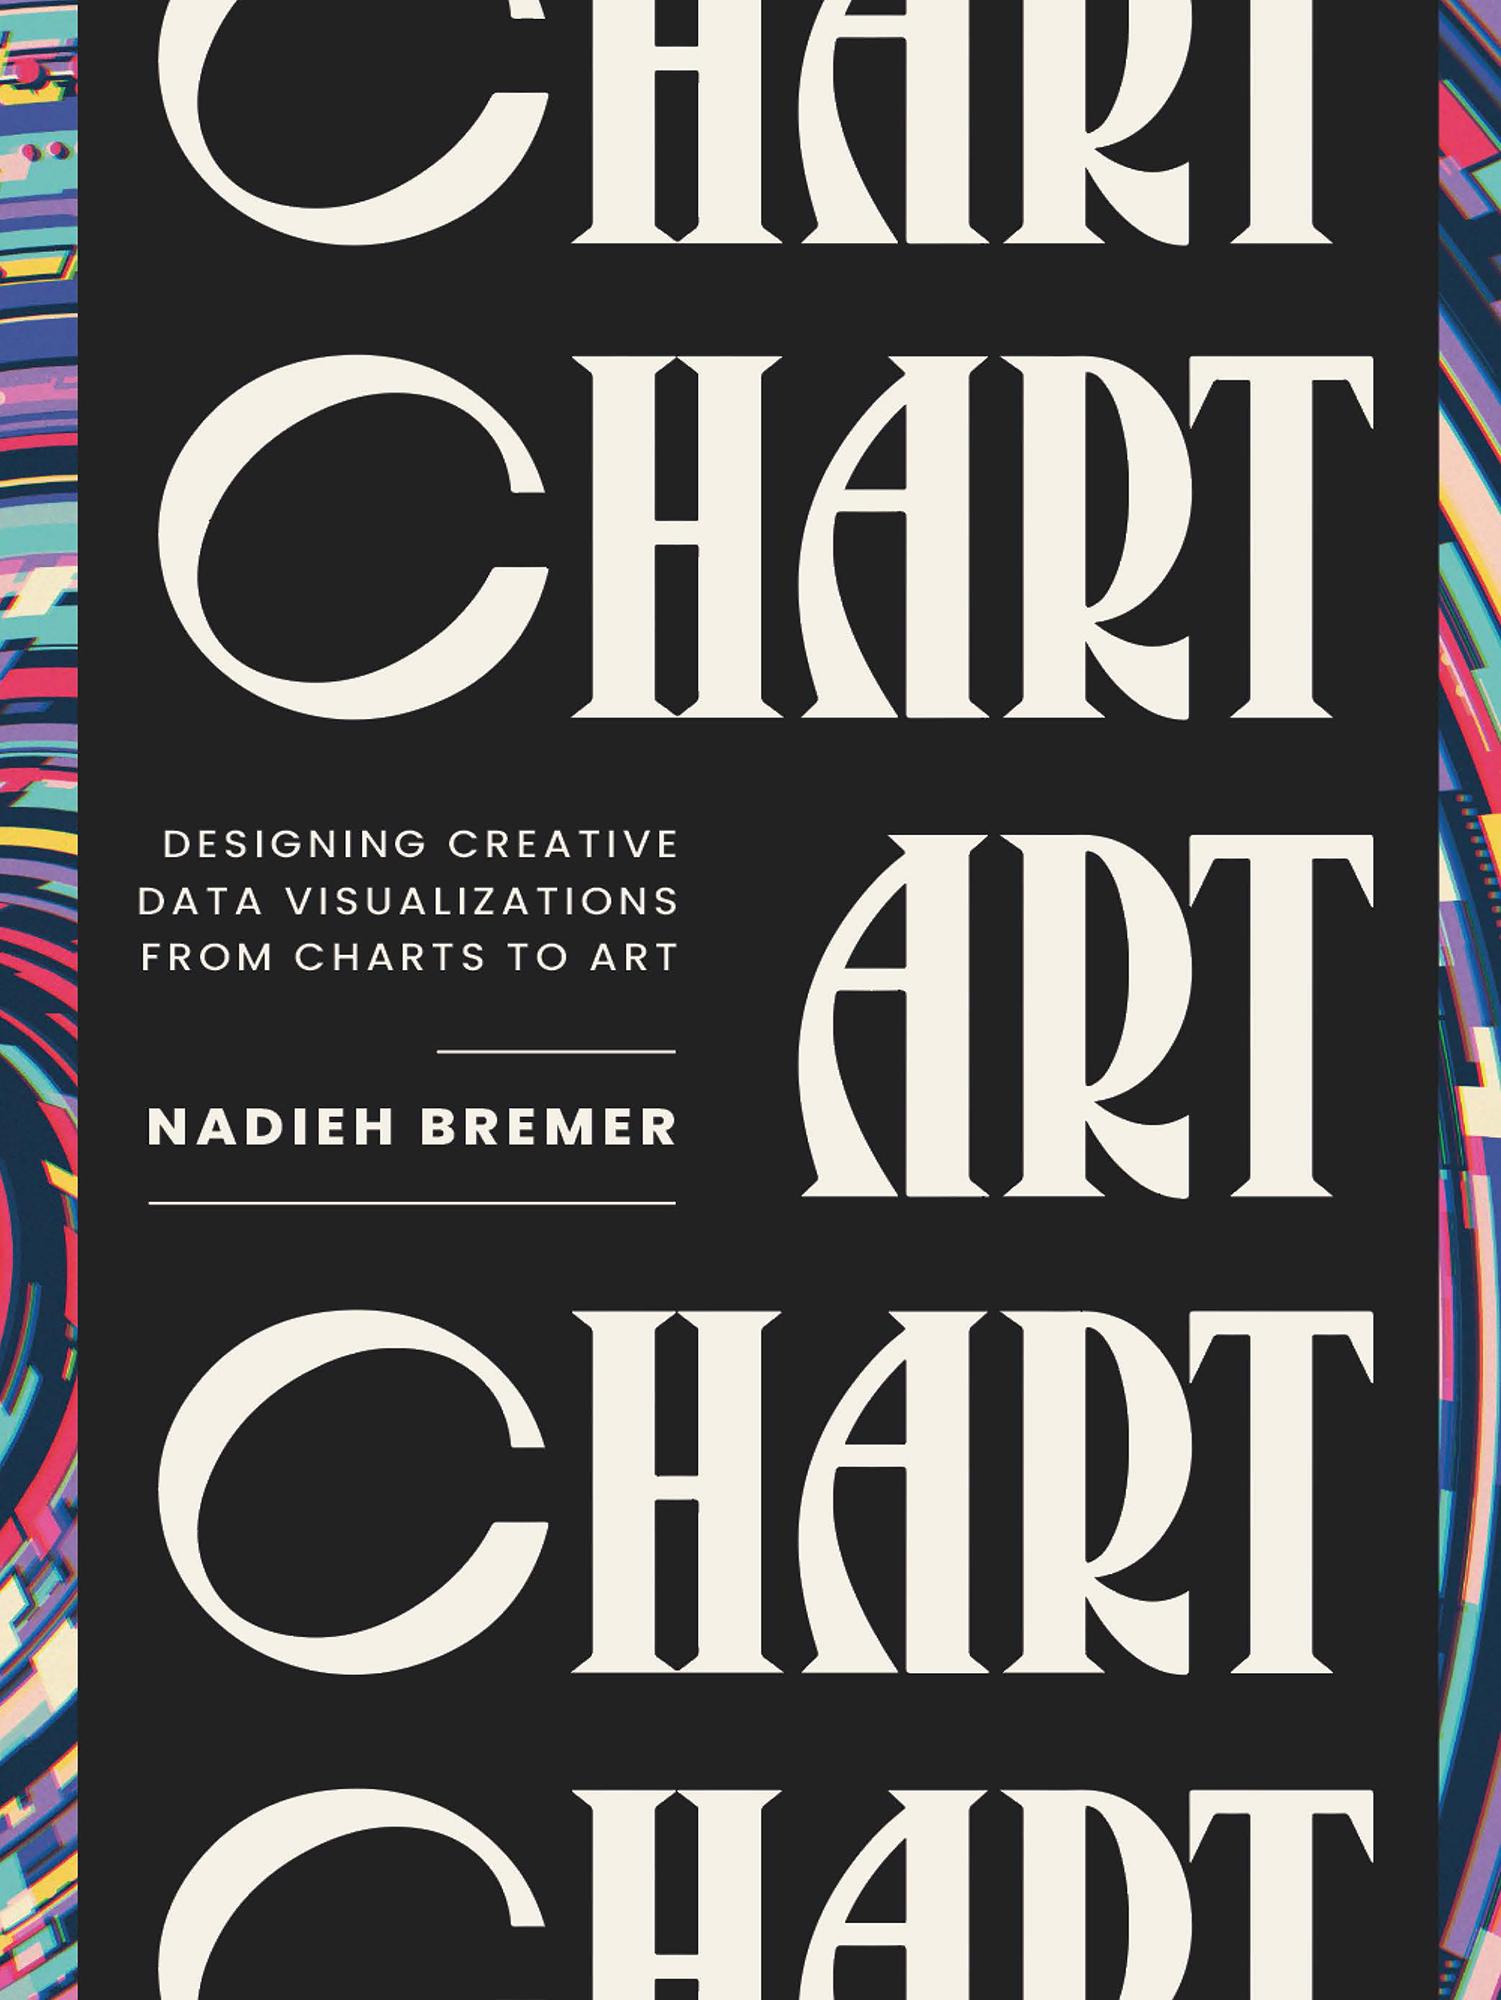
CHART is a guide to unleashing creativity in data visualization. It takes you on a journey along the spectrum from an ordinary chart to data art, packed with ways to bring more creativity into any visualization. It will help to make your visuals more compelling and memorable, long after the numbers have been crunched.
Drawing from over a decade of experience, the author shares thirteen hands-on, tool-agnostic lessons, each filled with actionable insights and unique perspectives. Between these core lessons, you’ll find tips, mini-chapters, and dozens of real-world examples from both client and personal projects. The book also includes exclusive glimpses into early sketches, works-in-progress, and in-depth design stories that reveal how creativity in data is often a messy, non-linear, but ultimately rewarding process.
CHART: Designing Creative Data Visualization from Charts to Art is designed for journalists, data analysts, business professionals, and newcomers alike, these lessons empower readers to push beyond the default. By the end of the book, you’ll have the tools and inspiration to transform typical charts and graphs into visuals that not only inform but also captivate and connect with your audience.
This book invites you to break the mold and think outside the chart.
Płać wygodnie kartą, Klarną, Apple Pay lub Google Pay. Nie jesteś zadowolony? Zawsze masz 14-dniową gwarancję zwrotu pieniędzy. Więcej przeczytasz w naszych warunkach. Masz pytania? Napisz do nas na hello@memmo.org.
Memmo ułatwia naukę – gdziekolwiek jesteś na świecie. U nas znajdziesz podręczniki i sprytne narzędzia do nauki w jednym miejscu: streszczenia, quizy, podcasty i fiszki. A do tego Ted, Twój kumpel do nauki, który odpowie na wszystko, co Cię nurtuje. Ponad 50 000 studentów już tu się uczy – stworzone, byś uczył się szybciej i mniej stresował.