
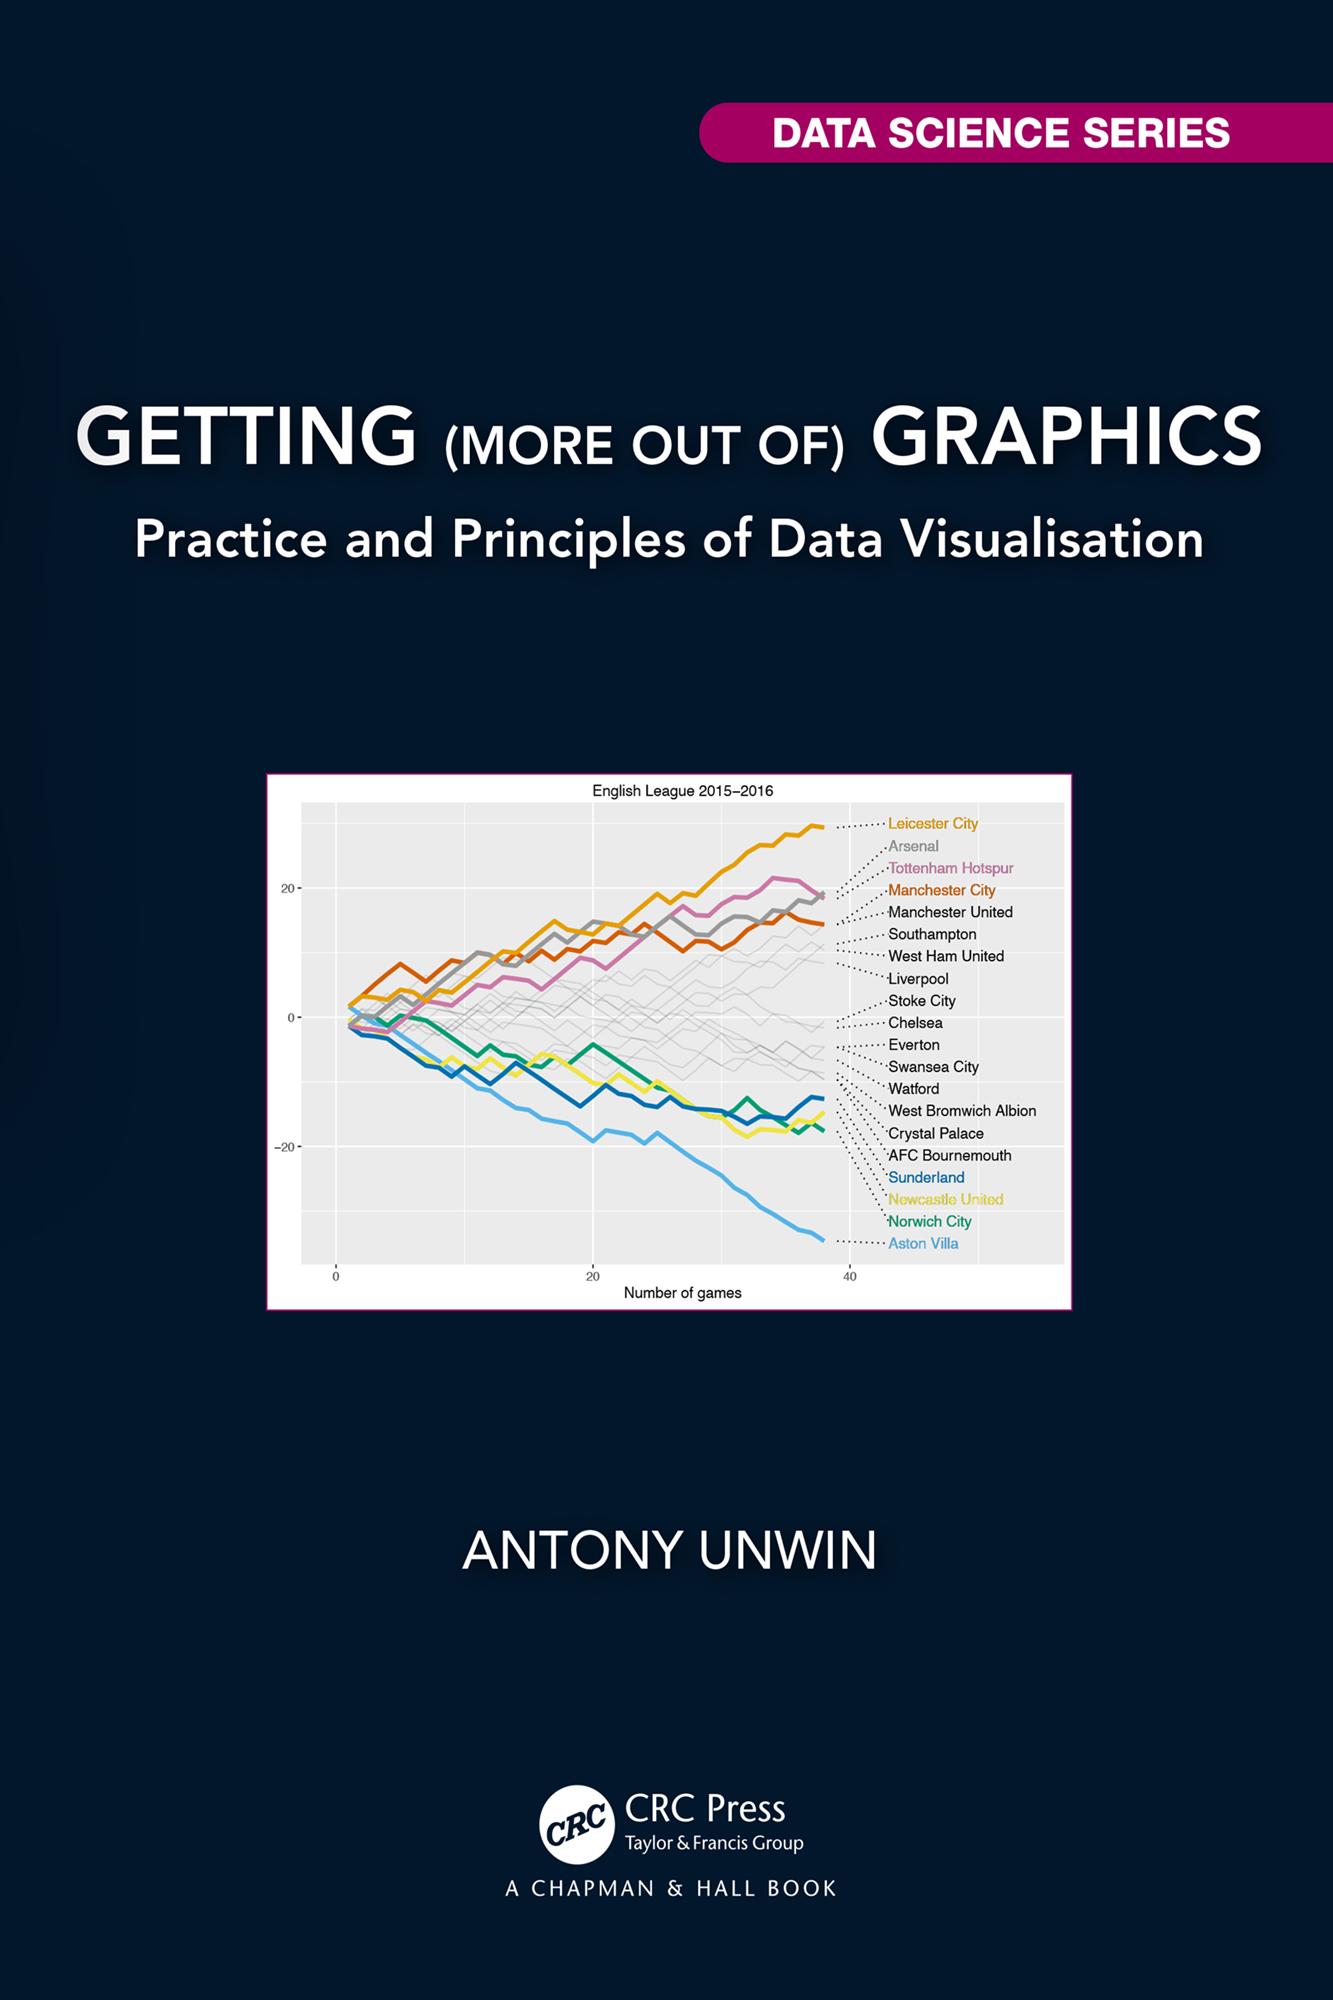
Data graphics are used extensively to present information. Understanding graphics is a lot about understanding the data represented by the graphics, having a feel not just for the numbers themselves, the reliability and uncertainty associated with them, but also for what they mean. This book presents a practical approach to data visualisation with real applications front and centre.
The first part of the book is a series of case studies, each describing a graphical analysis of a real dataset. The second part pulls together ideas from the case studies and provides an overview of the main factors affecting understanding graphics.
Key Features:
- Explains how to get insights from graphics.
- Emphasises the value of drawing many graphics.
- Underlines the importance for analysis of background knowledge and context.
Readers may be data scientists, statisticians or people who want to become more visually literate. A knowledge of Statistics is not required, just an interest in data graphics and some experience of working with data. It will help if the reader knows something of basic graphic forms such as barcharts, histograms, and scatterplots.
Płać wygodnie kartą, Klarną, Apple Pay lub Google Pay. Nie jesteś zadowolony? Zawsze masz 14-dniową gwarancję zwrotu pieniędzy. Więcej przeczytasz w naszych warunkach. Masz pytania? Napisz do nas na hello@memmo.org.
Memmo ułatwia naukę – gdziekolwiek jesteś na świecie. U nas znajdziesz podręczniki i sprytne narzędzia do nauki w jednym miejscu: streszczenia, quizy, podcasty i fiszki. A do tego Ted, Twój kumpel do nauki, który odpowie na wszystko, co Cię nurtuje. Ponad 50 000 studentów już tu się uczy – stworzone, byś uczył się szybciej i mniej stresował.