
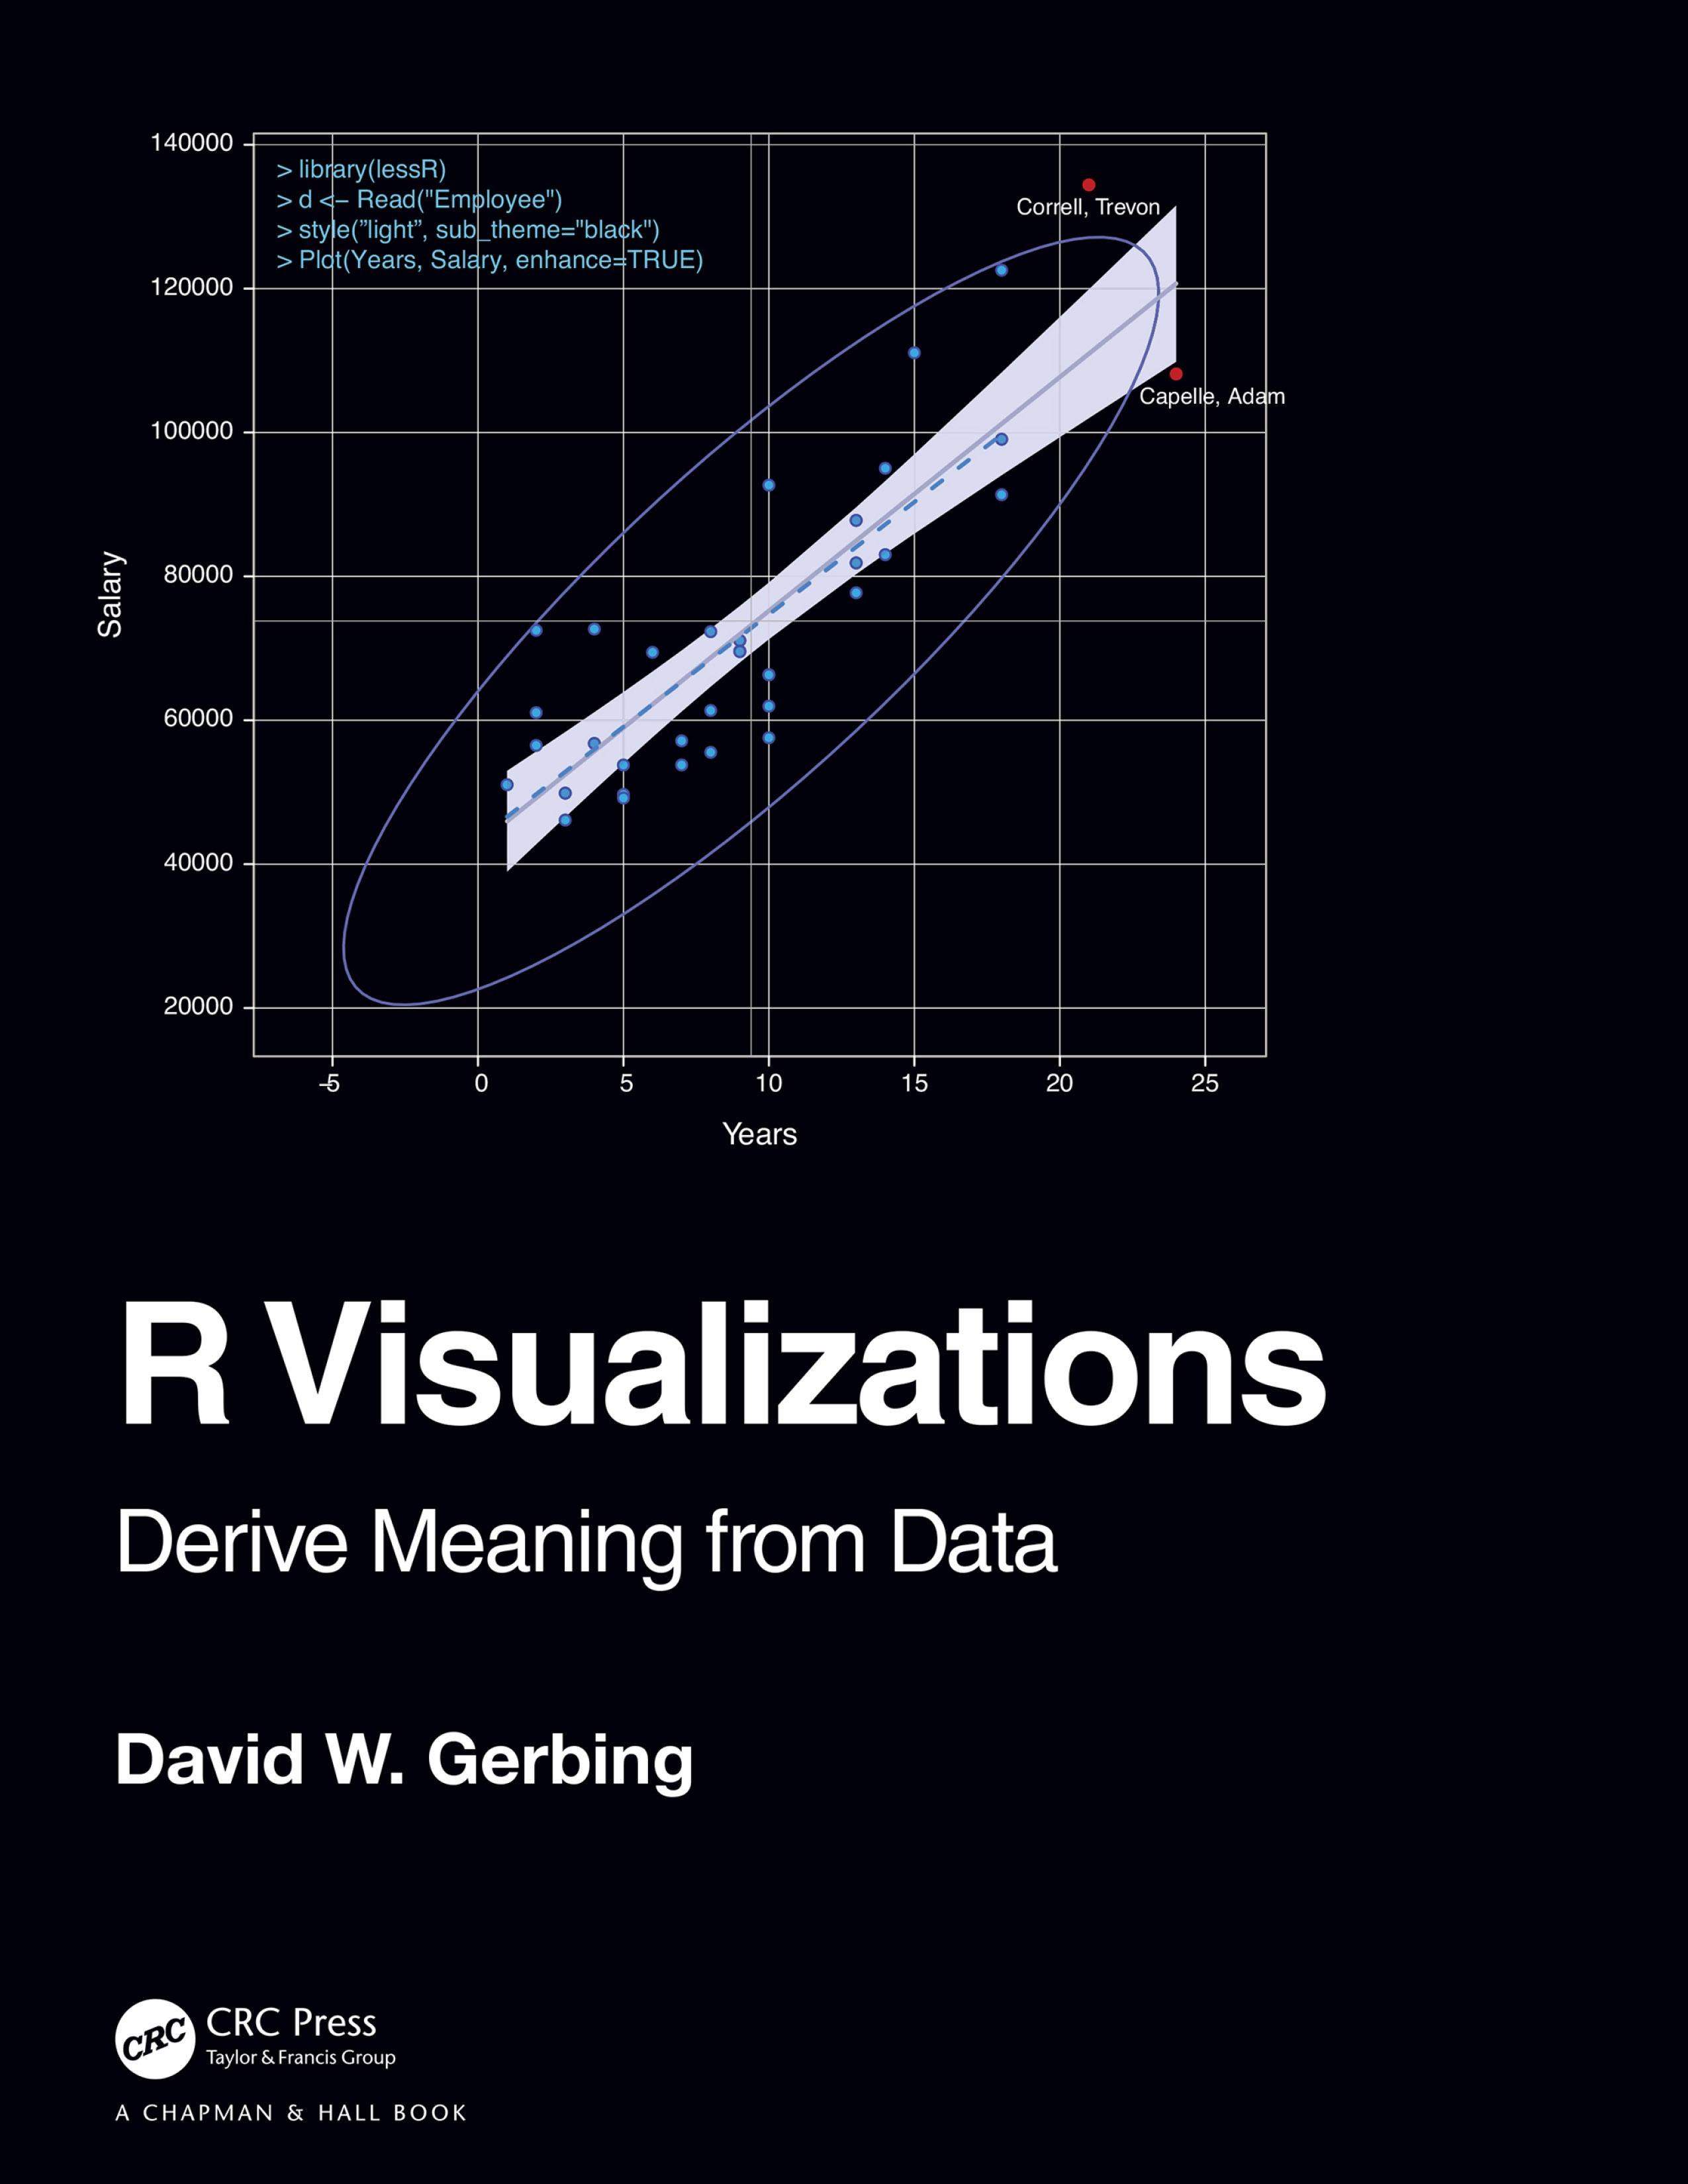
R Visualizations: Derive Meaning from Data focuses on one of the two major topics of data analytics: data visualization, a.k.a., computer graphics. In the book, major R systems for visualization are discussed, organized by topic and not by system. Anyone doing data analysis will be shown how to use R to generate any of the basic visualizations with the R visualization systems. Further, this book introduces the author’s lessR system, which always can accomplish a visualization with less coding than the use of other systems, sometimes dramatically so, and also provides accompanying statistical analyses.
Key Features
- Presents thorough coverage of the leading R visualization system, ggplot2.
- Gives specific guidance on using base R graphics to attain visualizations of the same quality as those provided by ggplot2.
-
Shows how to create a wide range of data visualizations: distributions of categorical and continuous variables, many types of scatterplots including with a third variable, time series, and maps.
- Inclusion of the various approaches to R graphics organized by topic instead of by system.
- Presents the recent work on interactive visualization in R.
David W. Gerbing received his PhD from Michigan State University in 1979 in quantitative analysis, and currently is a professor of quantitative analysis in the School of Business at Portland State University. He has published extensively in the social and behavioral sciences with a focus on quantitative methods. His lessR package has been in development since 2009.
Płać wygodnie kartą, Klarną, Apple Pay lub Google Pay. Nie jesteś zadowolony? Zawsze masz 14-dniową gwarancję zwrotu pieniędzy. Więcej przeczytasz w naszych warunkach. Masz pytania? Napisz do nas na hello@memmo.org.
Memmo ułatwia naukę – gdziekolwiek jesteś na świecie. U nas znajdziesz podręczniki i sprytne narzędzia do nauki w jednym miejscu: streszczenia, quizy, podcasty i fiszki. A do tego Ted, Twój kumpel do nauki, który odpowie na wszystko, co Cię nurtuje. Ponad 50 000 studentów już tu się uczy – stworzone, byś uczył się szybciej i mniej stresował.