
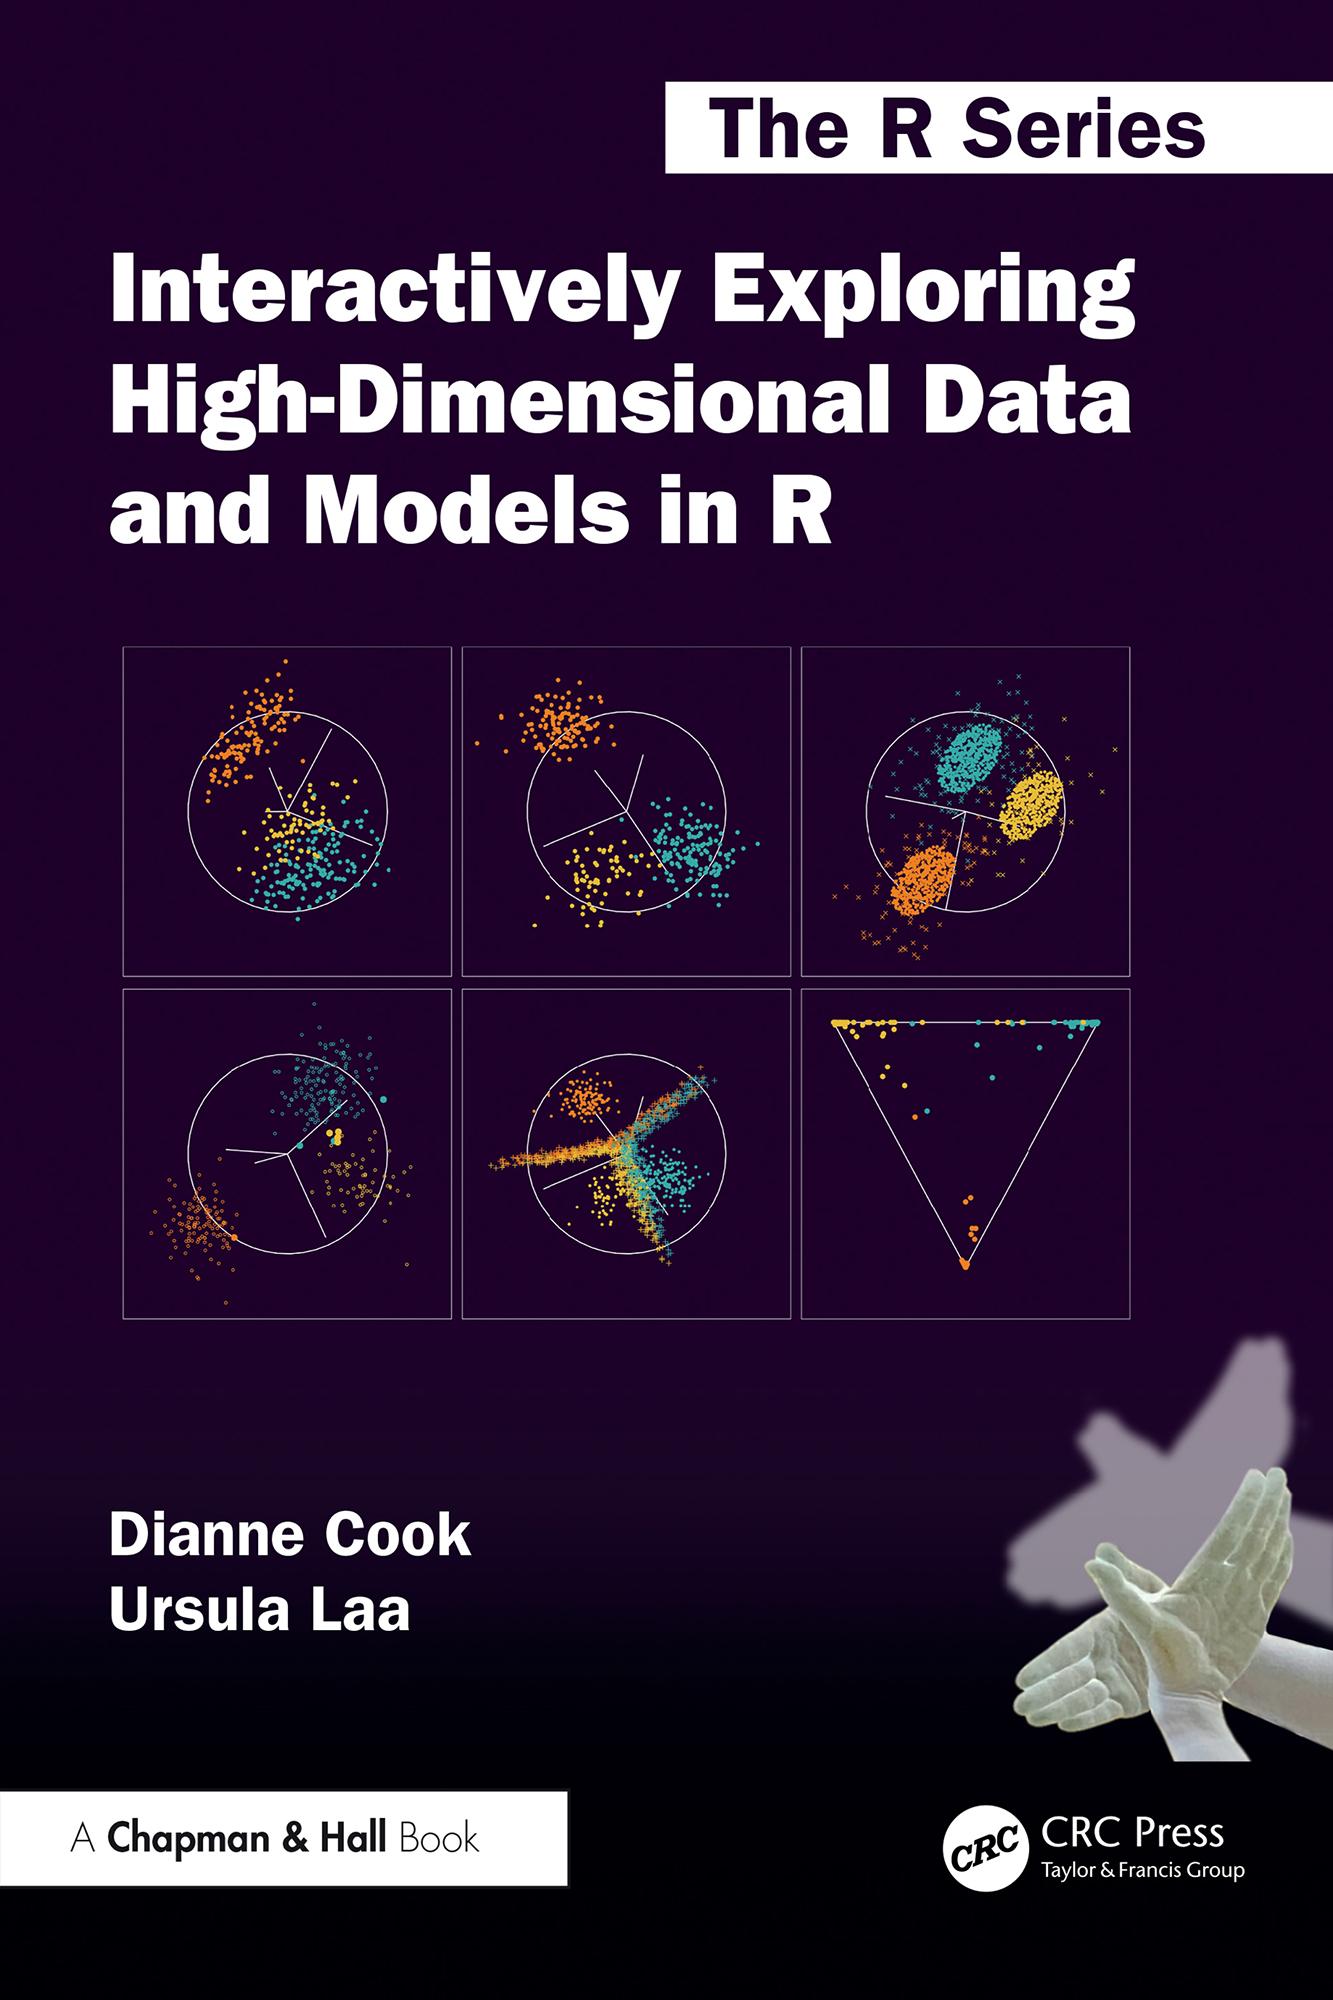
Visualizing data is a powerful tool for uncovering patterns and insights that might otherwise remain hidden. While there are numerous resources available for data visualization, few focus comprehensively on high-dimensional data visualization. High-dimensional data, or multivariate data, arises when multiple variables are measured for each observation, presenting unique challenges and opportunities for analysis. High-dimensional data visualisation is valuable for understanding dimension reduction methods, unsupervised and supervised classification. This book provides a detailed guide to visualizing high-dimensional data and models using linear projections, with practical examples and R code to help readers explore these fascinating data spaces.
Through this book, readers will learn how to identify patterns, clusters, and anomalies in high-dimensional data that are often obscured in lower-dimensional plots. By integrating visualization techniques with analytical methods, the book aims to enhance the understanding and interpretation of complex data structures, making it an essential resource for anyone working with multivariate data. The book is organised into three parts, following overview and introductory chapters. The dimension reduction chapters cover principal component analysis and nonlinear dimension reduction. The chapters on cluster analysis cover hierarchical and k-means algorithms, model-based and self-organising maps, and finish with ways to communicate results and how to compare different results. The chapters on classification cover linear discriminant analysis, tree and forest algorithms, support vector machines and neural networks.
Key Features
- Comprehensive Introduction: Learn the fundamentals of high-dimensional spaces, visualization techniques, and essential notation for advanced methods.
- Dimension Reduction Techniques: Explore linear and non-linear methods to summarize high-dimensional data, detect issues, and evaluate representation quality.
- Cluster Analysis: Discover graphical and numerical approaches to identify groups in data, assess clustering techniques, and visualize solutions in high dimensions.
- Classification Methods: Understand how to explore known groups, check model assumptions, examine classification boundaries, and identify errors.
- Integration with R: Includes R code examples using packages like tourr, detourr, and mulgar to complement explanations and plots.
- Toolbox Chapter: A dedicated appendix chapter provides an overview of primary visualization methods and guidance for getting started.
This book is designed for students, educators, researchers, data analysts, and industry professionals working in fields such as biology, social sciences, finance, and machine learning. It is particularly suited for those engaged in exploratory data analysis and model fitting for multivariate data. To make effective use of this material the reader should have a basic working knowledge of R and some understanding of multivariate statistical methods or machine learning methods.
Betaal eenvoudig met kaart, Klarna, Apple Pay of Google Pay. Niet tevreden? Je hebt altijd 14 dagen bedenktijd. Lees meer in onze voorwaarden. Heb je vragen, mail ons dan via hello@memmo.org.
Memmo maakt studeren makkelijker – waar je ook bent ter wereld. Wij brengen je cursusboeken en slimme studietools samen op één plek: samenvattingen, quizzen, podcasts en flashcards. En Ted, je studievriend die antwoord geeft op alles wat je je afvraagt. Meer dan 50.000 studenten studeren hier al – gebouwd om je sneller te laten leren en minder stress te geven.