
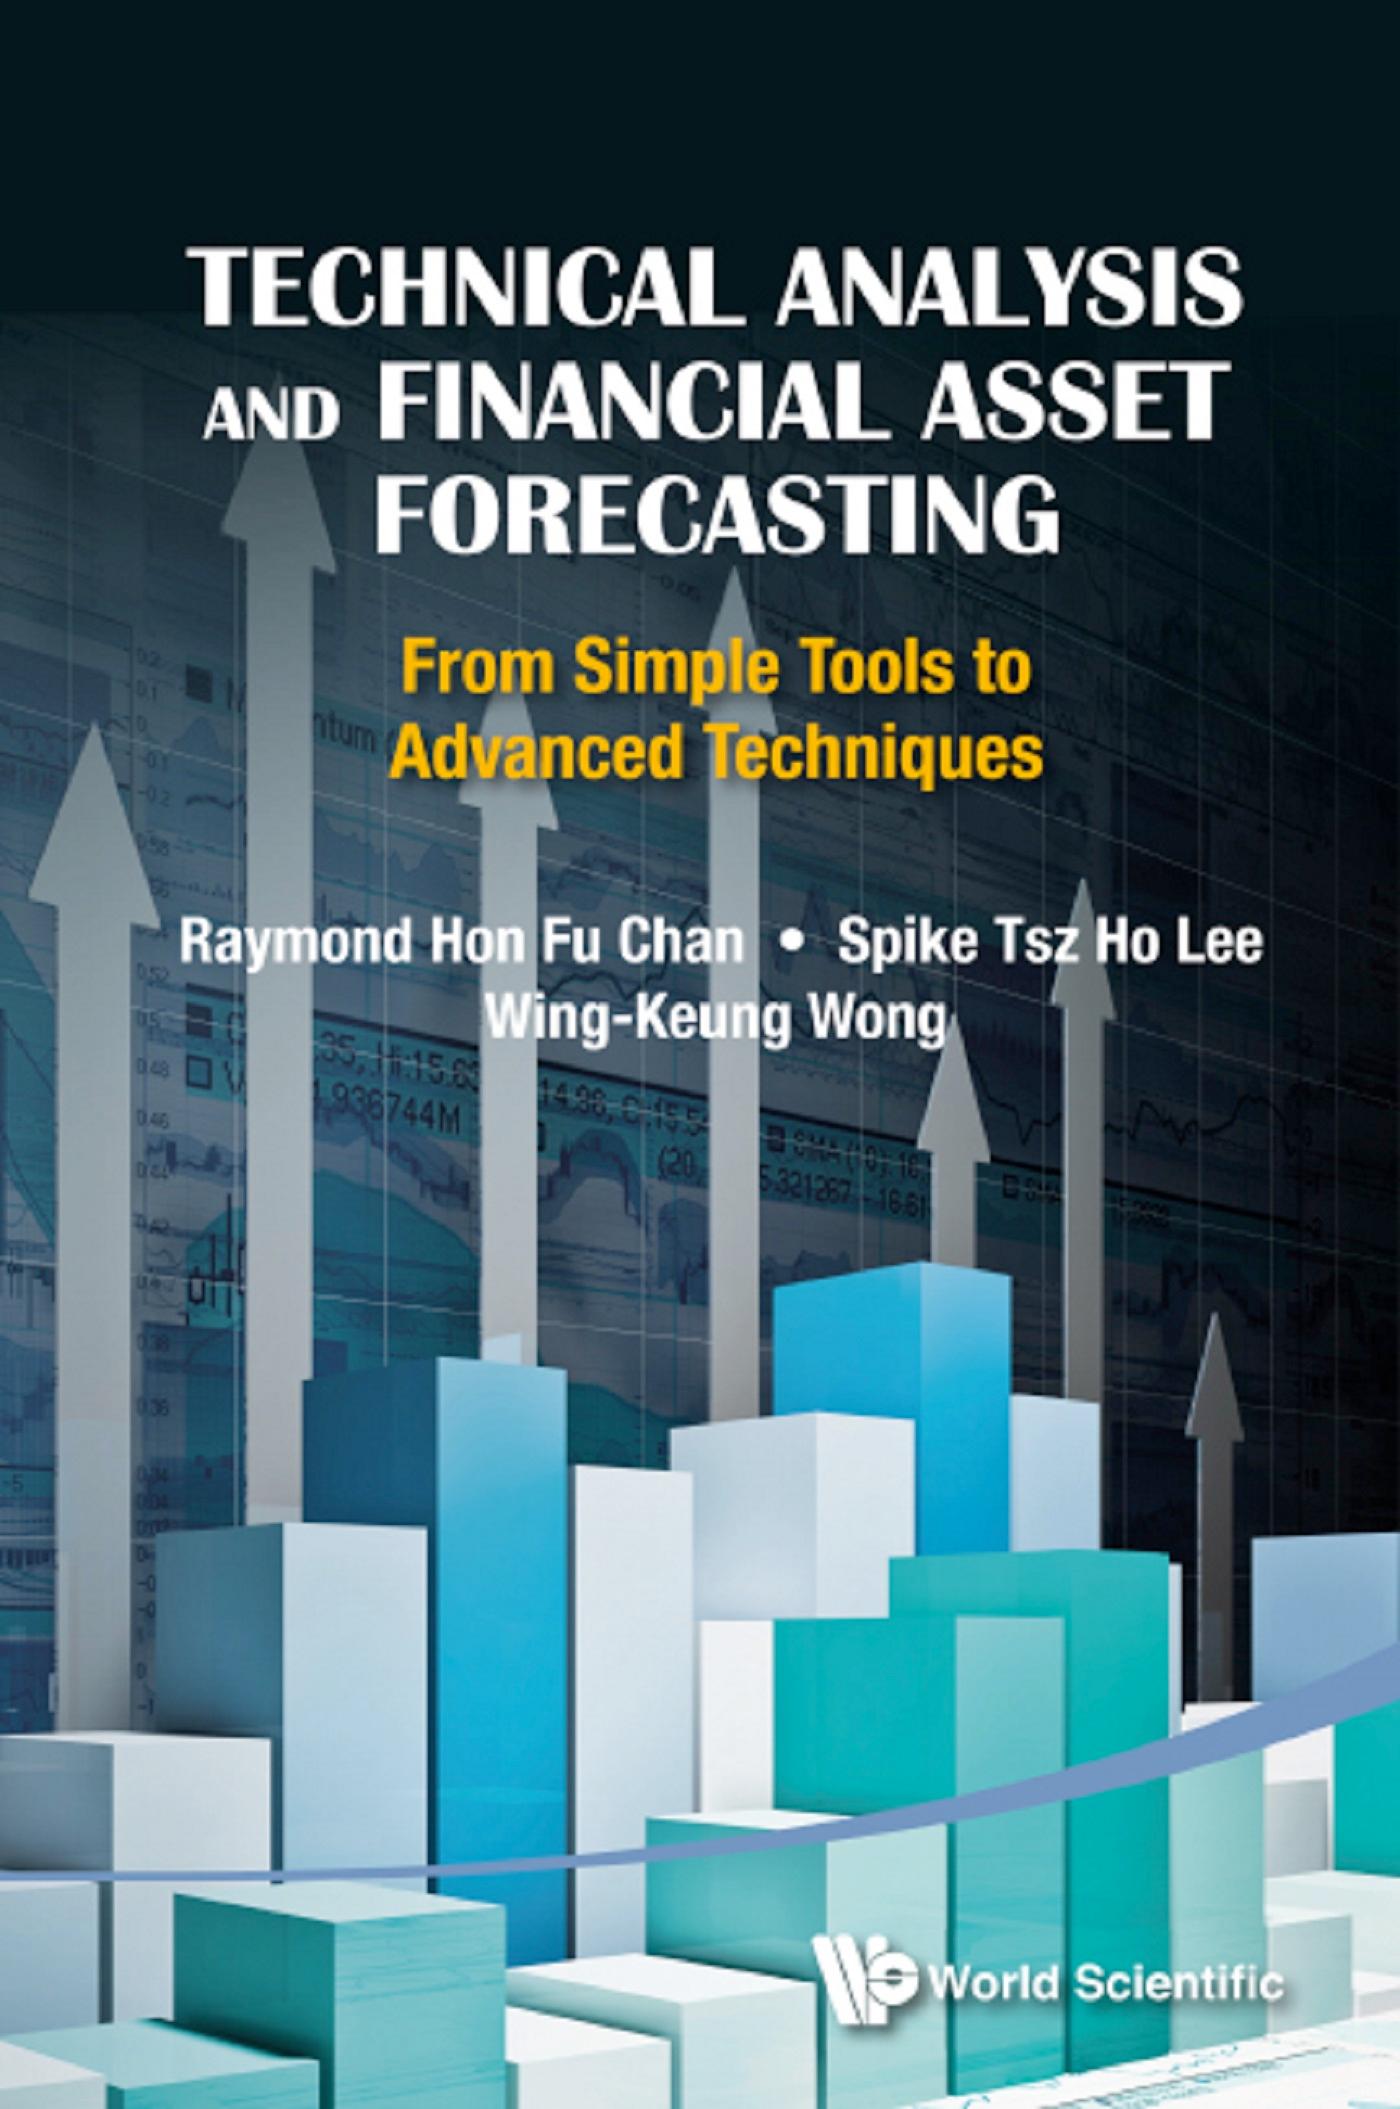
Technical analysis is defined as the tracking and prediction of asset price movements using charts and graphs in combination with various mathematical and statistical methods. More precisely, it is the quantitative criteria used in predicting the relative strength of buying and selling forces within a market to determine what to buy, what to sell, and when to execute trades. This book introduces simple technical analysis tools like moving averages and Bollinger bands, and also advanced techniques such as wavelets and empirical mode decomposition. It first discusses some traditional tools in technical analysis, such as trend, trend Line, trend channel, Gann's Theory, moving averages, and Bollinger bands. It then introduces a recent indicator developed for stock market and two recent techniques used in the technical analysis field: wavelets and the empirical mode decomposition in financial time series. The book also discusses the theory to test the performance of the indicators and introduces the MATLAB Financial Toolbox, some of the functions/codes of which are used in our numerical experiments.
Zahle einfach mit Karte, Klarna, Apple Pay oder Google Pay. Nicht zufrieden? Du hast immer ein 14-tägiges Widerrufsrecht. Lies mehr in unseren AGB. Hast du Fragen, schreib uns eine E-Mail an hello@memmo.org.
Memmo macht das Lernen einfacher – wo auch immer du bist. Bei uns findest du deine Kursbücher und smarte Lerntools an einem Ort: Zusammenfassungen, Quizzes, Podcasts und Lernkarten. Und Ted, dein Lernbuddy, beantwortet alles, was du wissen möchtest. Über 50.000 Studierende lernen bereits hier – gemacht, damit du schneller lernst und weniger Stress hast.
Das könnte dir auch gefallen
Buch kaufen0