
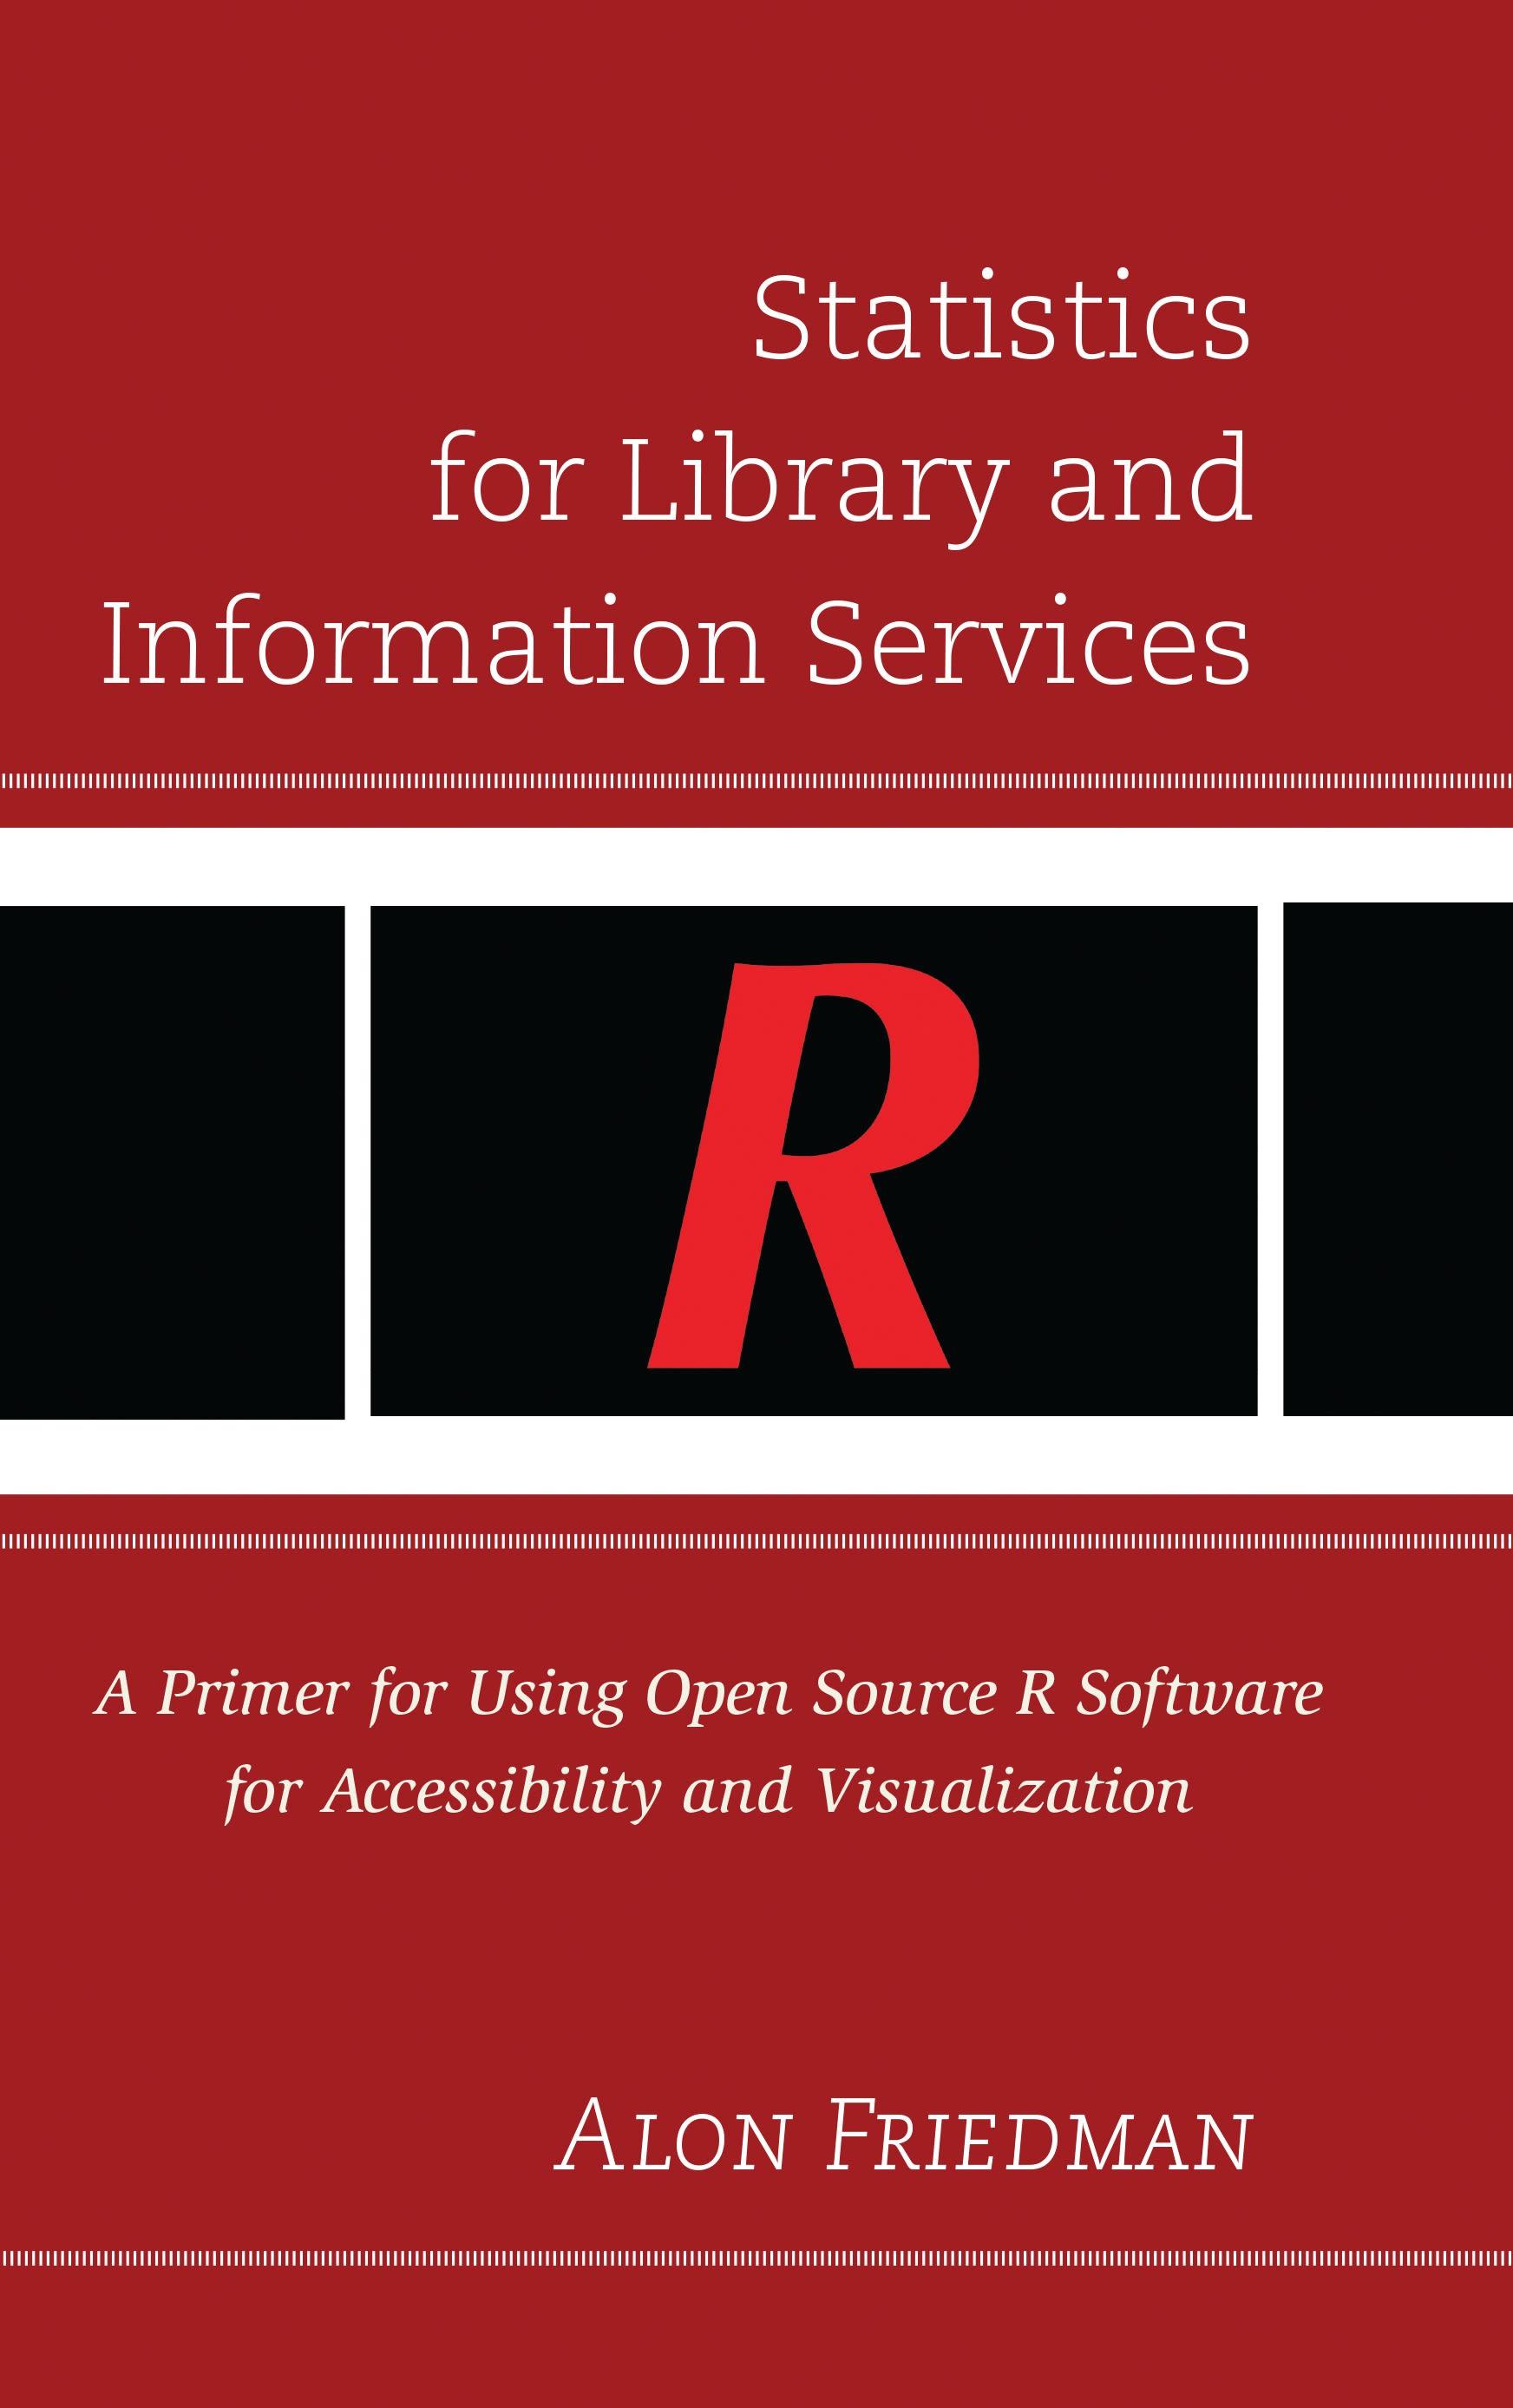
Statistics for Library and Information Services, written for non-statisticians, provides logical, user-friendly, and step-by-step instructions to make statistics more accessible for students and professionals in the field of Information Science. It emphasizes concepts of statistical theory and data collection methodologies, but also extends to the topics of visualization creation and display, so that the reader will be able to better conduct statistical analysis and communicate his/her findings.
The book is tailored for information science students and professionals. It has specific examples of dataset sets, scripts, design modules, data repositories, homework assignments, and a glossary lexicon that matches the field of Information Science. The textbook provides a visual road map that is customized specifically for Information Science instructors, students, and professionals regarding statistics and visualization.
Each chapter in the book includes full-color illustrations on how to use R for the statistical model that particular chapter will cover.
This book is arranged in 17 chapters, which are organized into five main sections:
the first section introduces research design and data collection;the second section discusses basic statistical concepts, including descriptive, bivariate, time series, and regression analyses; section 3 covers the subject of visualization creation using Open Source R; section 4 covers decision making from the analysis; and the last section provides examples and references.
Every chapter illustrates how to use Open Source R and features two subsections for the major ideas of the chapter: its statistical model and its visual representation. The statistical model captures the main statistical formulas/theories covered in each chapter, while the visual representation addresses the subject of the types of visualization that are produced from the statistical analysis model covered in that particular chapter.
Don’t miss the book’s companion Web site at www.statisticsforlis.org
The book is tailored for information science students and professionals. It has specific examples of dataset sets, scripts, design modules, data repositories, homework assignments, and a glossary lexicon that matches the field of Information Science. The textbook provides a visual road map that is customized specifically for Information Science instructors, students, and professionals regarding statistics and visualization.
Each chapter in the book includes full-color illustrations on how to use R for the statistical model that particular chapter will cover.
This book is arranged in 17 chapters, which are organized into five main sections:
the first section introduces research design and data collection;the second section discusses basic statistical concepts, including descriptive, bivariate, time series, and regression analyses; section 3 covers the subject of visualization creation using Open Source R; section 4 covers decision making from the analysis; and the last section provides examples and references.
Every chapter illustrates how to use Open Source R and features two subsections for the major ideas of the chapter: its statistical model and its visual representation. The statistical model captures the main statistical formulas/theories covered in each chapter, while the visual representation addresses the subject of the types of visualization that are produced from the statistical analysis model covered in that particular chapter.
Don’t miss the book’s companion Web site at www.statisticsforlis.org
Zahle einfach mit Karte, Klarna, Apple Pay oder Google Pay. Nicht zufrieden? Du hast immer ein 14-tägiges Widerrufsrecht. Lies mehr in unseren AGB. Hast du Fragen, schreib uns eine E-Mail an hello@memmo.org.
Memmo macht das Lernen einfacher – wo auch immer du bist. Bei uns findest du deine Kursbücher und smarte Lerntools an einem Ort: Zusammenfassungen, Quizzes, Podcasts und Lernkarten. Und Ted, dein Lernbuddy, beantwortet alles, was du wissen möchtest. Über 50.000 Studierende lernen bereits hier – gemacht, damit du schneller lernst und weniger Stress hast.