
See How Graphics Reveal Information
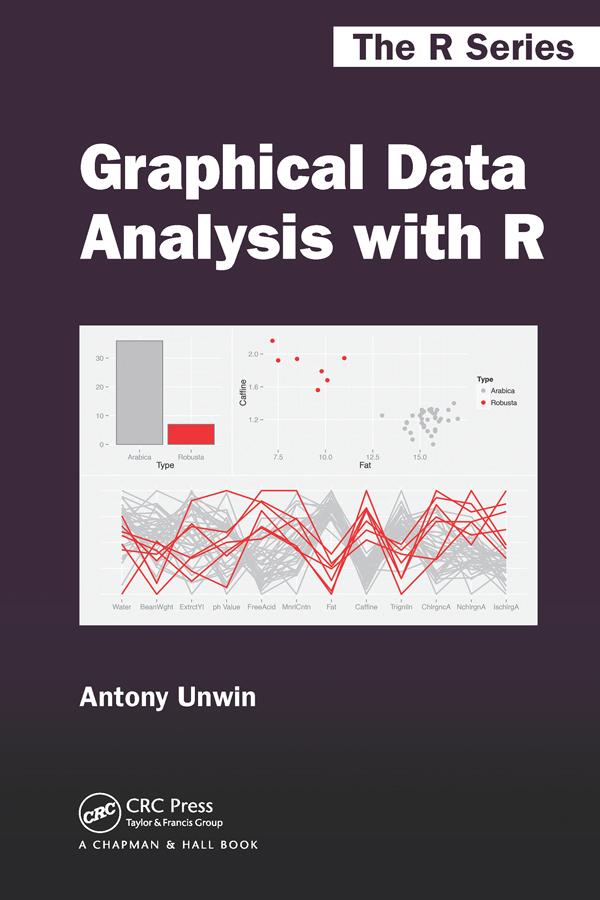
Graphical Data Analysis with R shows you what information you can gain from graphical displays. The book focuses on why you draw graphics to display data and which graphics to draw (and uses R to do so). All the datasets are available in R or one of its packages and the R code is available at rosuda.org/GDA.
Graphical data analysis is useful for data cleaning, exploring data structure, detecting outliers and unusual groups, identifying trends and clusters, spotting local patterns, evaluating modelling output, and presenting results. This book guides you in choosing graphics and understanding what information you can glean from them. It can be used as a primary text in a graphical data analysis course or as a supplement in a statistics course. Colour graphics are used throughout.
Zahle einfach mit Karte, Klarna, Apple Pay oder Google Pay. Nicht zufrieden? Du hast immer ein 14-tägiges Widerrufsrecht. Lies mehr in unseren AGB. Hast du Fragen, schreib uns eine E-Mail an hello@memmo.org.
Memmo macht das Lernen einfacher – wo auch immer du bist. Bei uns findest du deine Kursbücher und smarte Lerntools an einem Ort: Zusammenfassungen, Quizzes, Podcasts und Lernkarten. Und Ted, dein Lernbuddy, beantwortet alles, was du wissen möchtest. Über 50.000 Studierende lernen bereits hier – gemacht, damit du schneller lernst und weniger Stress hast.