
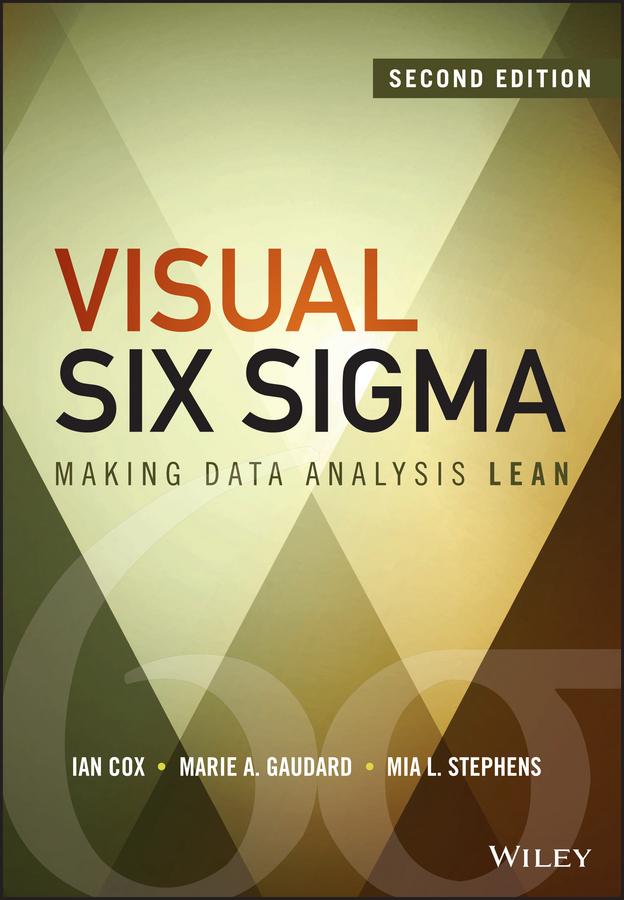
Visual Six Sigma provides the statistical techniques that help you get more information from your data. A unique emphasis on the visual allows you to take a more active role in data-driven decision making, so you can leverage your contextual knowledge to pose relevant questions and make more sound decisions. You'll learn dynamic visualization and exploratory data analysis techniques that help you identify occurrences and sources of variation, and the strategies and processes that make Six Sigma work for your organization.
The Six Sigma strategy helps you identify and remove causes of defects and errors in manufacturing and business processes; the more pragmatic Visual approach opens the strategy beyond the realms of statisticians to provide value to all business leaders amid the growing need for more accessible quality management tools.
- See where, why, and how your data varies
- Find clues to underlying behavior in your data
- Identify key models and drivers
- Build your own Six-Sigma experience
Whether your work involves a Six Sigma improvement project, a design project, a data-mining inquiry, or a scientific study, this practical breakthrough guide equips you with the skills and understanding to get more from your data. With intuitive, easy-to-use tools and clear explanations, Visual Six Sigma is a roadmap to putting this strategy to work for your company.
Zahle einfach mit Karte, Klarna, Apple Pay oder Google Pay. Nicht zufrieden? Du hast immer ein 14-tägiges Widerrufsrecht. Lies mehr in unseren AGB. Hast du Fragen, schreib uns eine E-Mail an hello@memmo.org.
Memmo macht das Lernen einfacher – wo auch immer du bist. Bei uns findest du deine Kursbücher und smarte Lerntools an einem Ort: Zusammenfassungen, Quizzes, Podcasts und Lernkarten. Und Ted, dein Lernbuddy, beantwortet alles, was du wissen möchtest. Über 50.000 Studierende lernen bereits hier – gemacht, damit du schneller lernst und weniger Stress hast.