
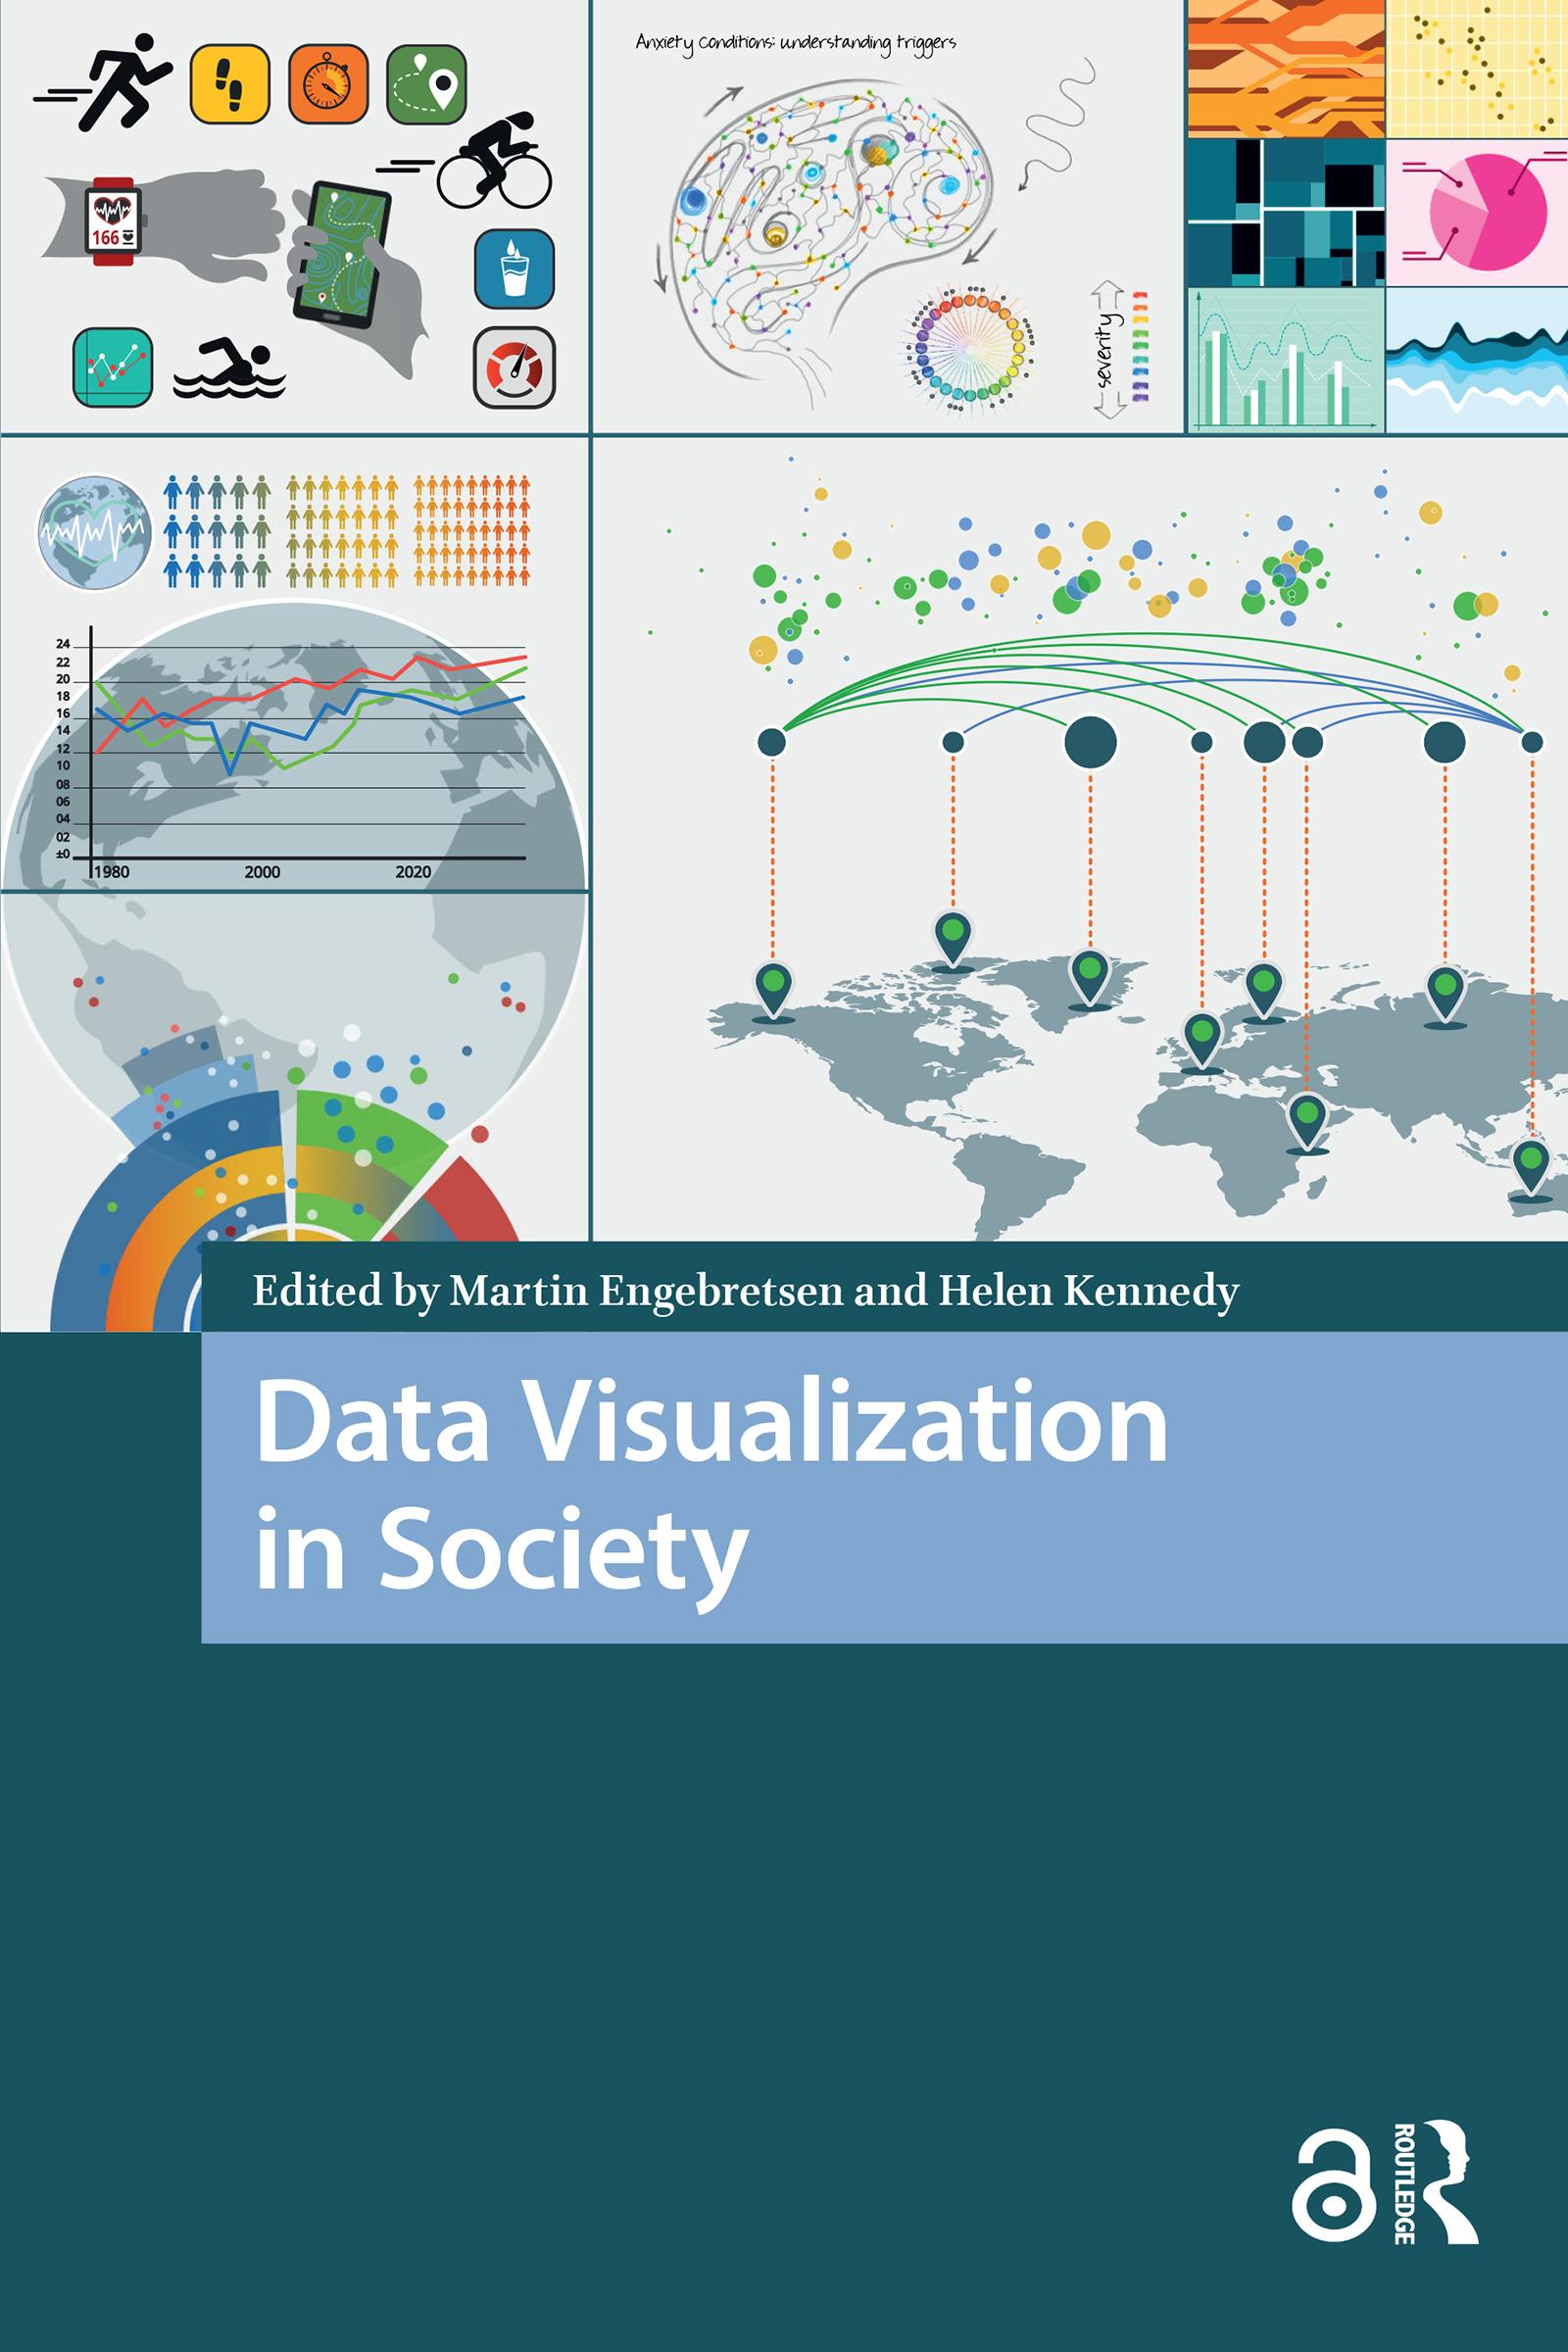
Today we are witnessing an increased use of data visualization in society. Across domains such as work, education and the news, various forms of graphs, charts and maps are used to explain, convince and tell stories. In an era in which more and more data are produced and circulated digitally, and digital tools make visualization production increasingly accessible, it is important to study the conditions under which such visual texts are generated, disseminated and thought to be of societal benefit. This book is a contribution to the multi-disciplined and multi-faceted conversation concerning the forms, uses and roles of data visualization in society. Do data visualizations do 'good' or 'bad'? Do they promote understanding and engagement, or do they do ideological work, privileging certain views of the world over others? The contributions in the book engage with these core questions from a range of disciplinary perspectives.
Seiten: 464
Kategorie: Samhällsvetenskap
e-ISBN: 9781040789933
Versandgewicht: 1.2 kg
Versand in: 1-2 Tage
Zahle einfach mit Karte, Klarna, Apple Pay oder Google Pay. Nicht zufrieden? Du hast immer ein 14-tägiges Widerrufsrecht. Lies mehr in unseren AGB. Hast du Fragen, schreib uns eine E-Mail an hello@memmo.org.
Memmo macht das Lernen einfacher – wo auch immer du bist. Bei uns findest du deine Kursbücher und smarte Lerntools an einem Ort: Zusammenfassungen, Quizzes, Podcasts und Lernkarten. Und Ted, dein Lernbuddy, beantwortet alles, was du wissen möchtest. Über 50.000 Studierende lernen bereits hier – gemacht, damit du schneller lernst und weniger Stress hast.
Das könnte dir auch gefallen
Buch kaufen0