
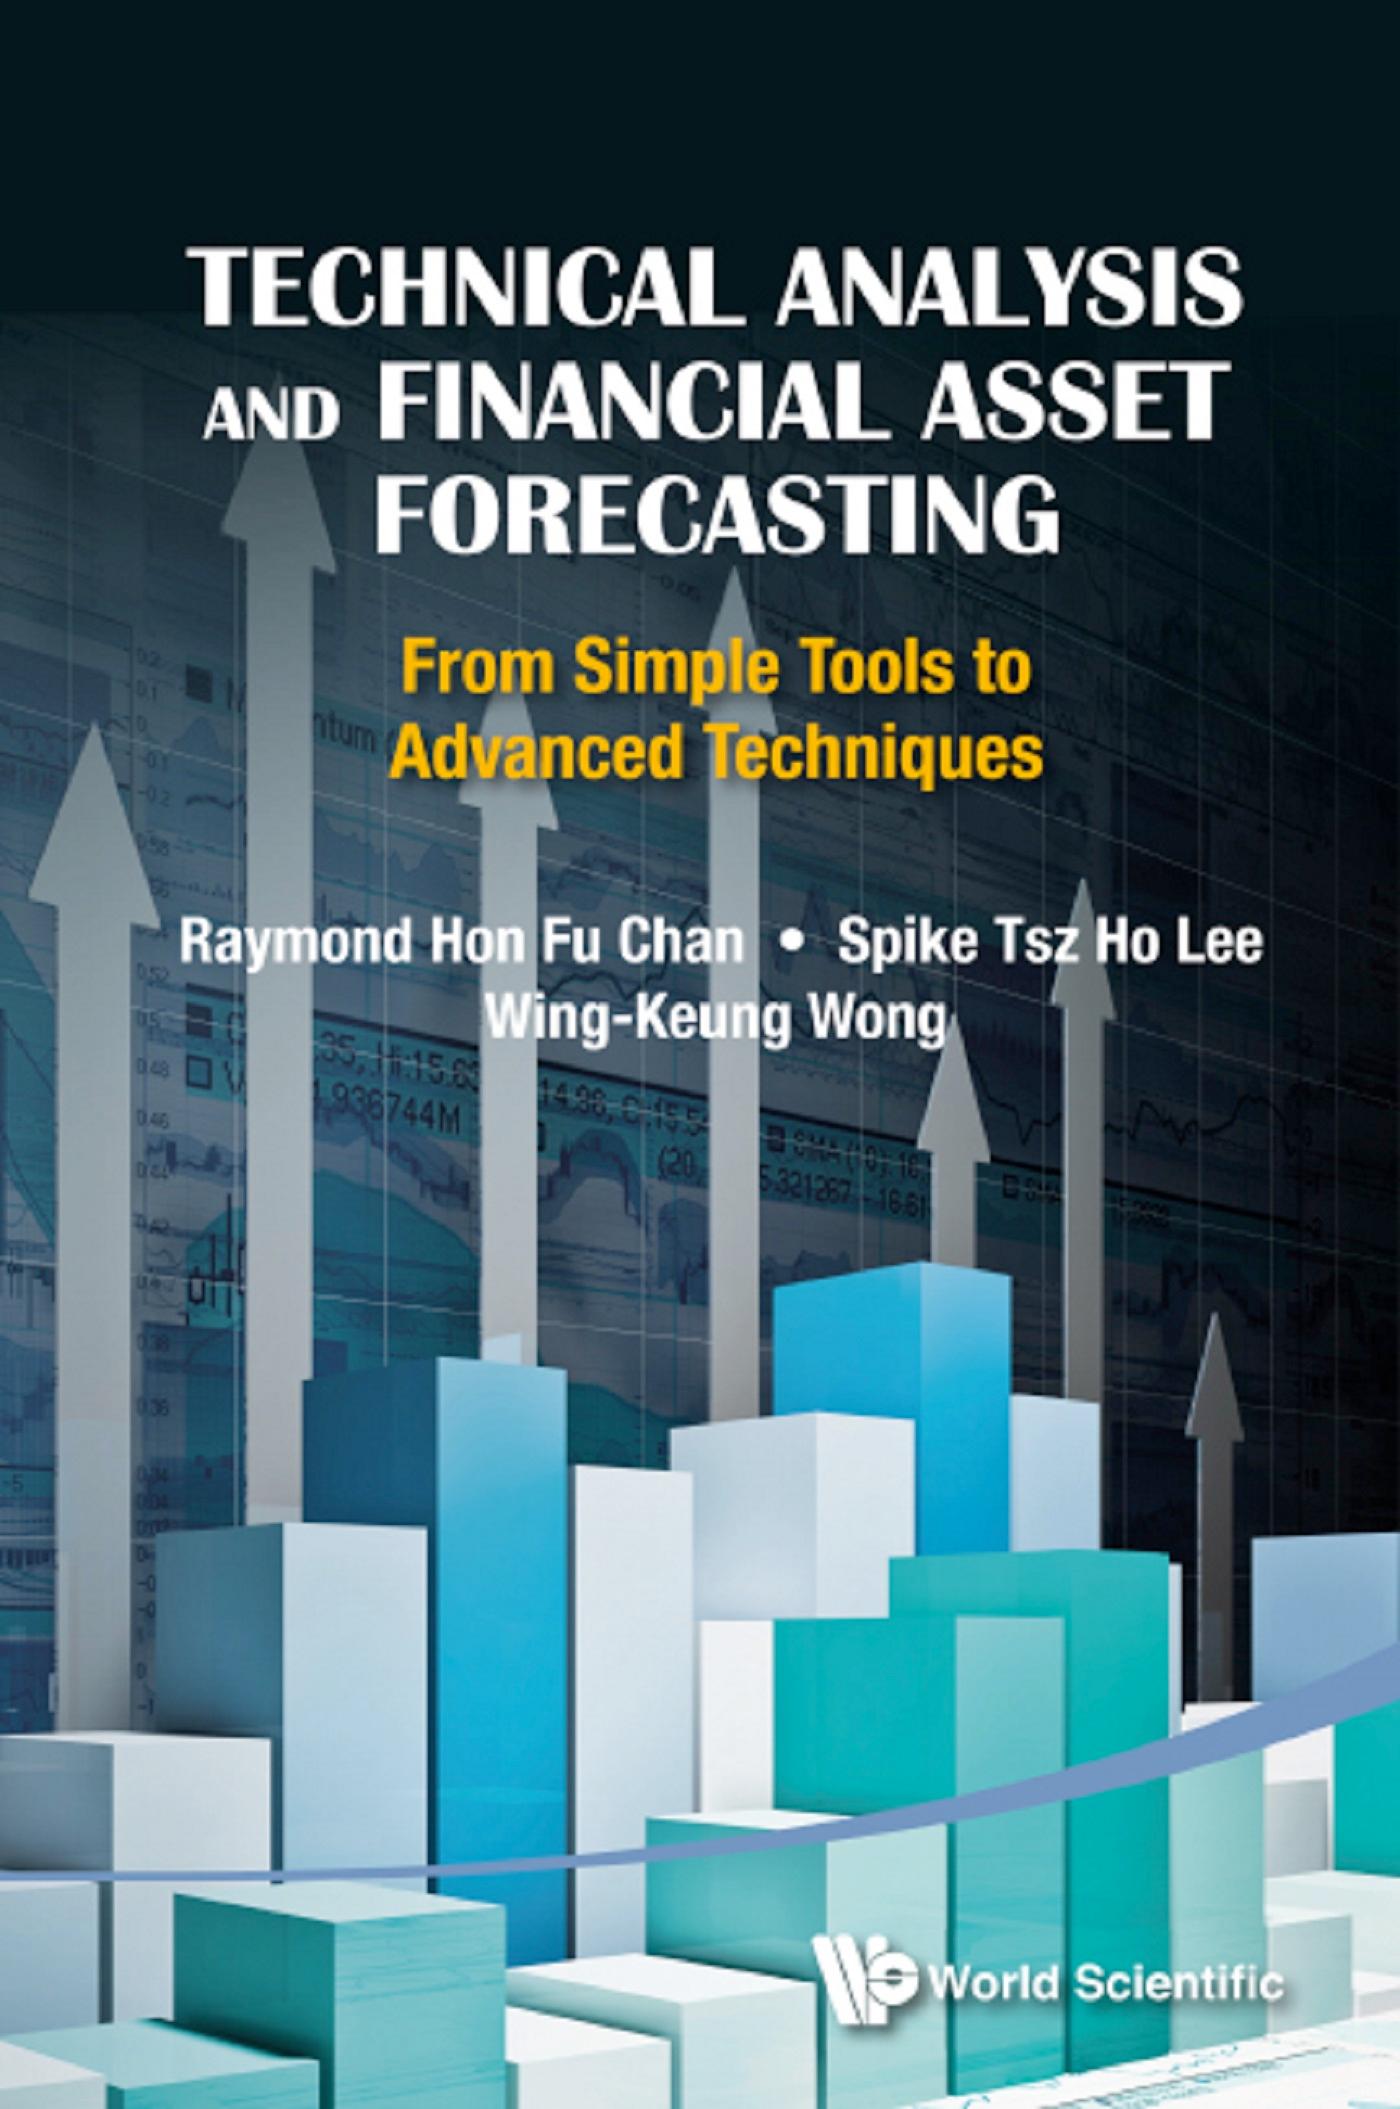
Technical analysis is defined as the tracking and prediction of asset price movements using charts and graphs in combination with various mathematical and statistical methods. More precisely, it is the quantitative criteria used in predicting the relative strength of buying and selling forces within a market to determine what to buy, what to sell, and when to execute trades. This book introduces simple technical analysis tools like moving averages and Bollinger bands, and also advanced techniques such as wavelets and empirical mode decomposition. It first discusses some traditional tools in technical analysis, such as trend, trend Line, trend channel, Gann's Theory, moving averages, and Bollinger bands. It then introduces a recent indicator developed for stock market and two recent techniques used in the technical analysis field: wavelets and the empirical mode decomposition in financial time series. The book also discusses the theory to test the performance of the indicators and introduces the MATLAB Financial Toolbox, some of the functions/codes of which are used in our numerical experiments.
Paga facilmente con carta, Klarna, Apple Pay o Google Pay. Non sei soddisfatto? Hai sempre 14 giorni per il rimborso. Leggi di più nei nostri termini. Per qualsiasi domanda, scrivici a hello@memmo.org.
Memmo rende lo studio più facile, ovunque tu sia nel mondo. Qui trovi i tuoi libri di testo e strumenti di studio intelligenti, tutto in un unico posto: riassunti, quiz, podcast e flashcard. E poi c'è Ted, il tuo compagno di studio che risponde a ogni tua domanda. Oltre 50.000 studenti studiano già qui: è stato creato per aiutarti a imparare più velocemente e a stressarti meno.
Potrebbe interessarti anche
Acquista il libro0