
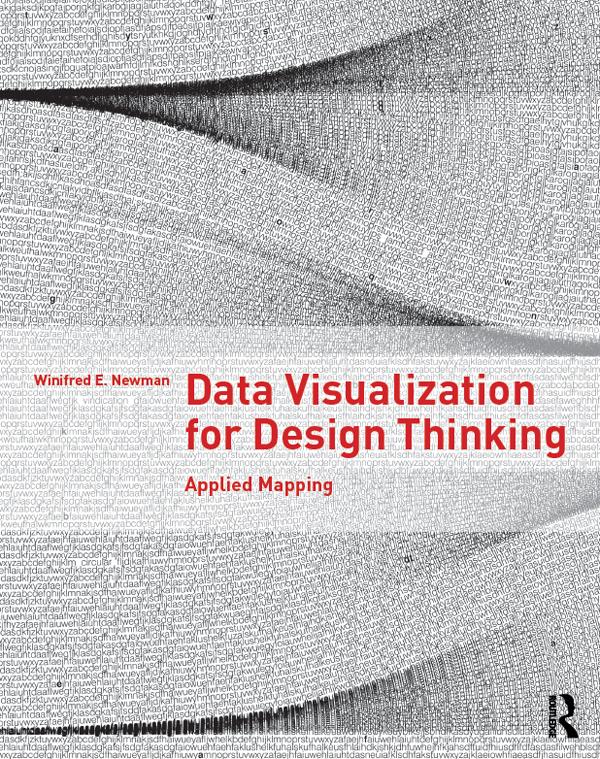
Data Visualization for Design Thinking helps you make better maps. Treating maps as applied research, you’ll be able to understand how to map sites, places, ideas, and projects, revealing the complex relationships between what you represent, your thinking, the technology you use, the culture you belong to, and your aesthetic practices. More than 100 examples illustrated with over 200 color images show you how to visualize data through mapping. Includes five in-depth cases studies and numerous examples throughout.
Paga facilmente con carta, Klarna, Apple Pay o Google Pay. Non sei soddisfatto? Hai sempre 14 giorni per il rimborso. Leggi di più nei nostri termini. Per qualsiasi domanda, scrivici a hello@memmo.org.
Memmo rende lo studio più facile, ovunque tu sia nel mondo. Qui trovi i tuoi libri di testo e strumenti di studio intelligenti, tutto in un unico posto: riassunti, quiz, podcast e flashcard. E poi c'è Ted, il tuo compagno di studio che risponde a ogni tua domanda. Oltre 50.000 studenti studiano già qui: è stato creato per aiutarti a imparare più velocemente e a stressarti meno.