
See How Graphics Reveal Information
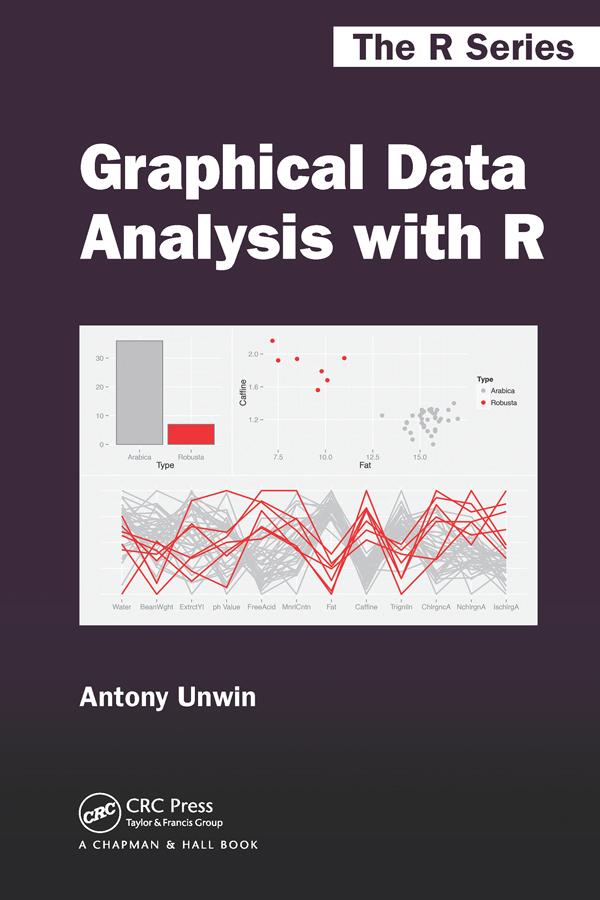
Graphical Data Analysis with R shows you what information you can gain from graphical displays. The book focuses on why you draw graphics to display data and which graphics to draw (and uses R to do so). All the datasets are available in R or one of its packages and the R code is available at rosuda.org/GDA.
Graphical data analysis is useful for data cleaning, exploring data structure, detecting outliers and unusual groups, identifying trends and clusters, spotting local patterns, evaluating modelling output, and presenting results. This book guides you in choosing graphics and understanding what information you can glean from them. It can be used as a primary text in a graphical data analysis course or as a supplement in a statistics course. Colour graphics are used throughout.
Paga facilmente con carta, Klarna, Apple Pay o Google Pay. Non sei soddisfatto? Hai sempre 14 giorni per il rimborso. Leggi di più nei nostri termini. Per qualsiasi domanda, scrivici a hello@memmo.org.
Memmo rende lo studio più facile, ovunque tu sia nel mondo. Qui trovi i tuoi libri di testo e strumenti di studio intelligenti, tutto in un unico posto: riassunti, quiz, podcast e flashcard. E poi c'è Ted, il tuo compagno di studio che risponde a ogni tua domanda. Oltre 50.000 studenti studiano già qui: è stato creato per aiutarti a imparare più velocemente e a stressarti meno.