
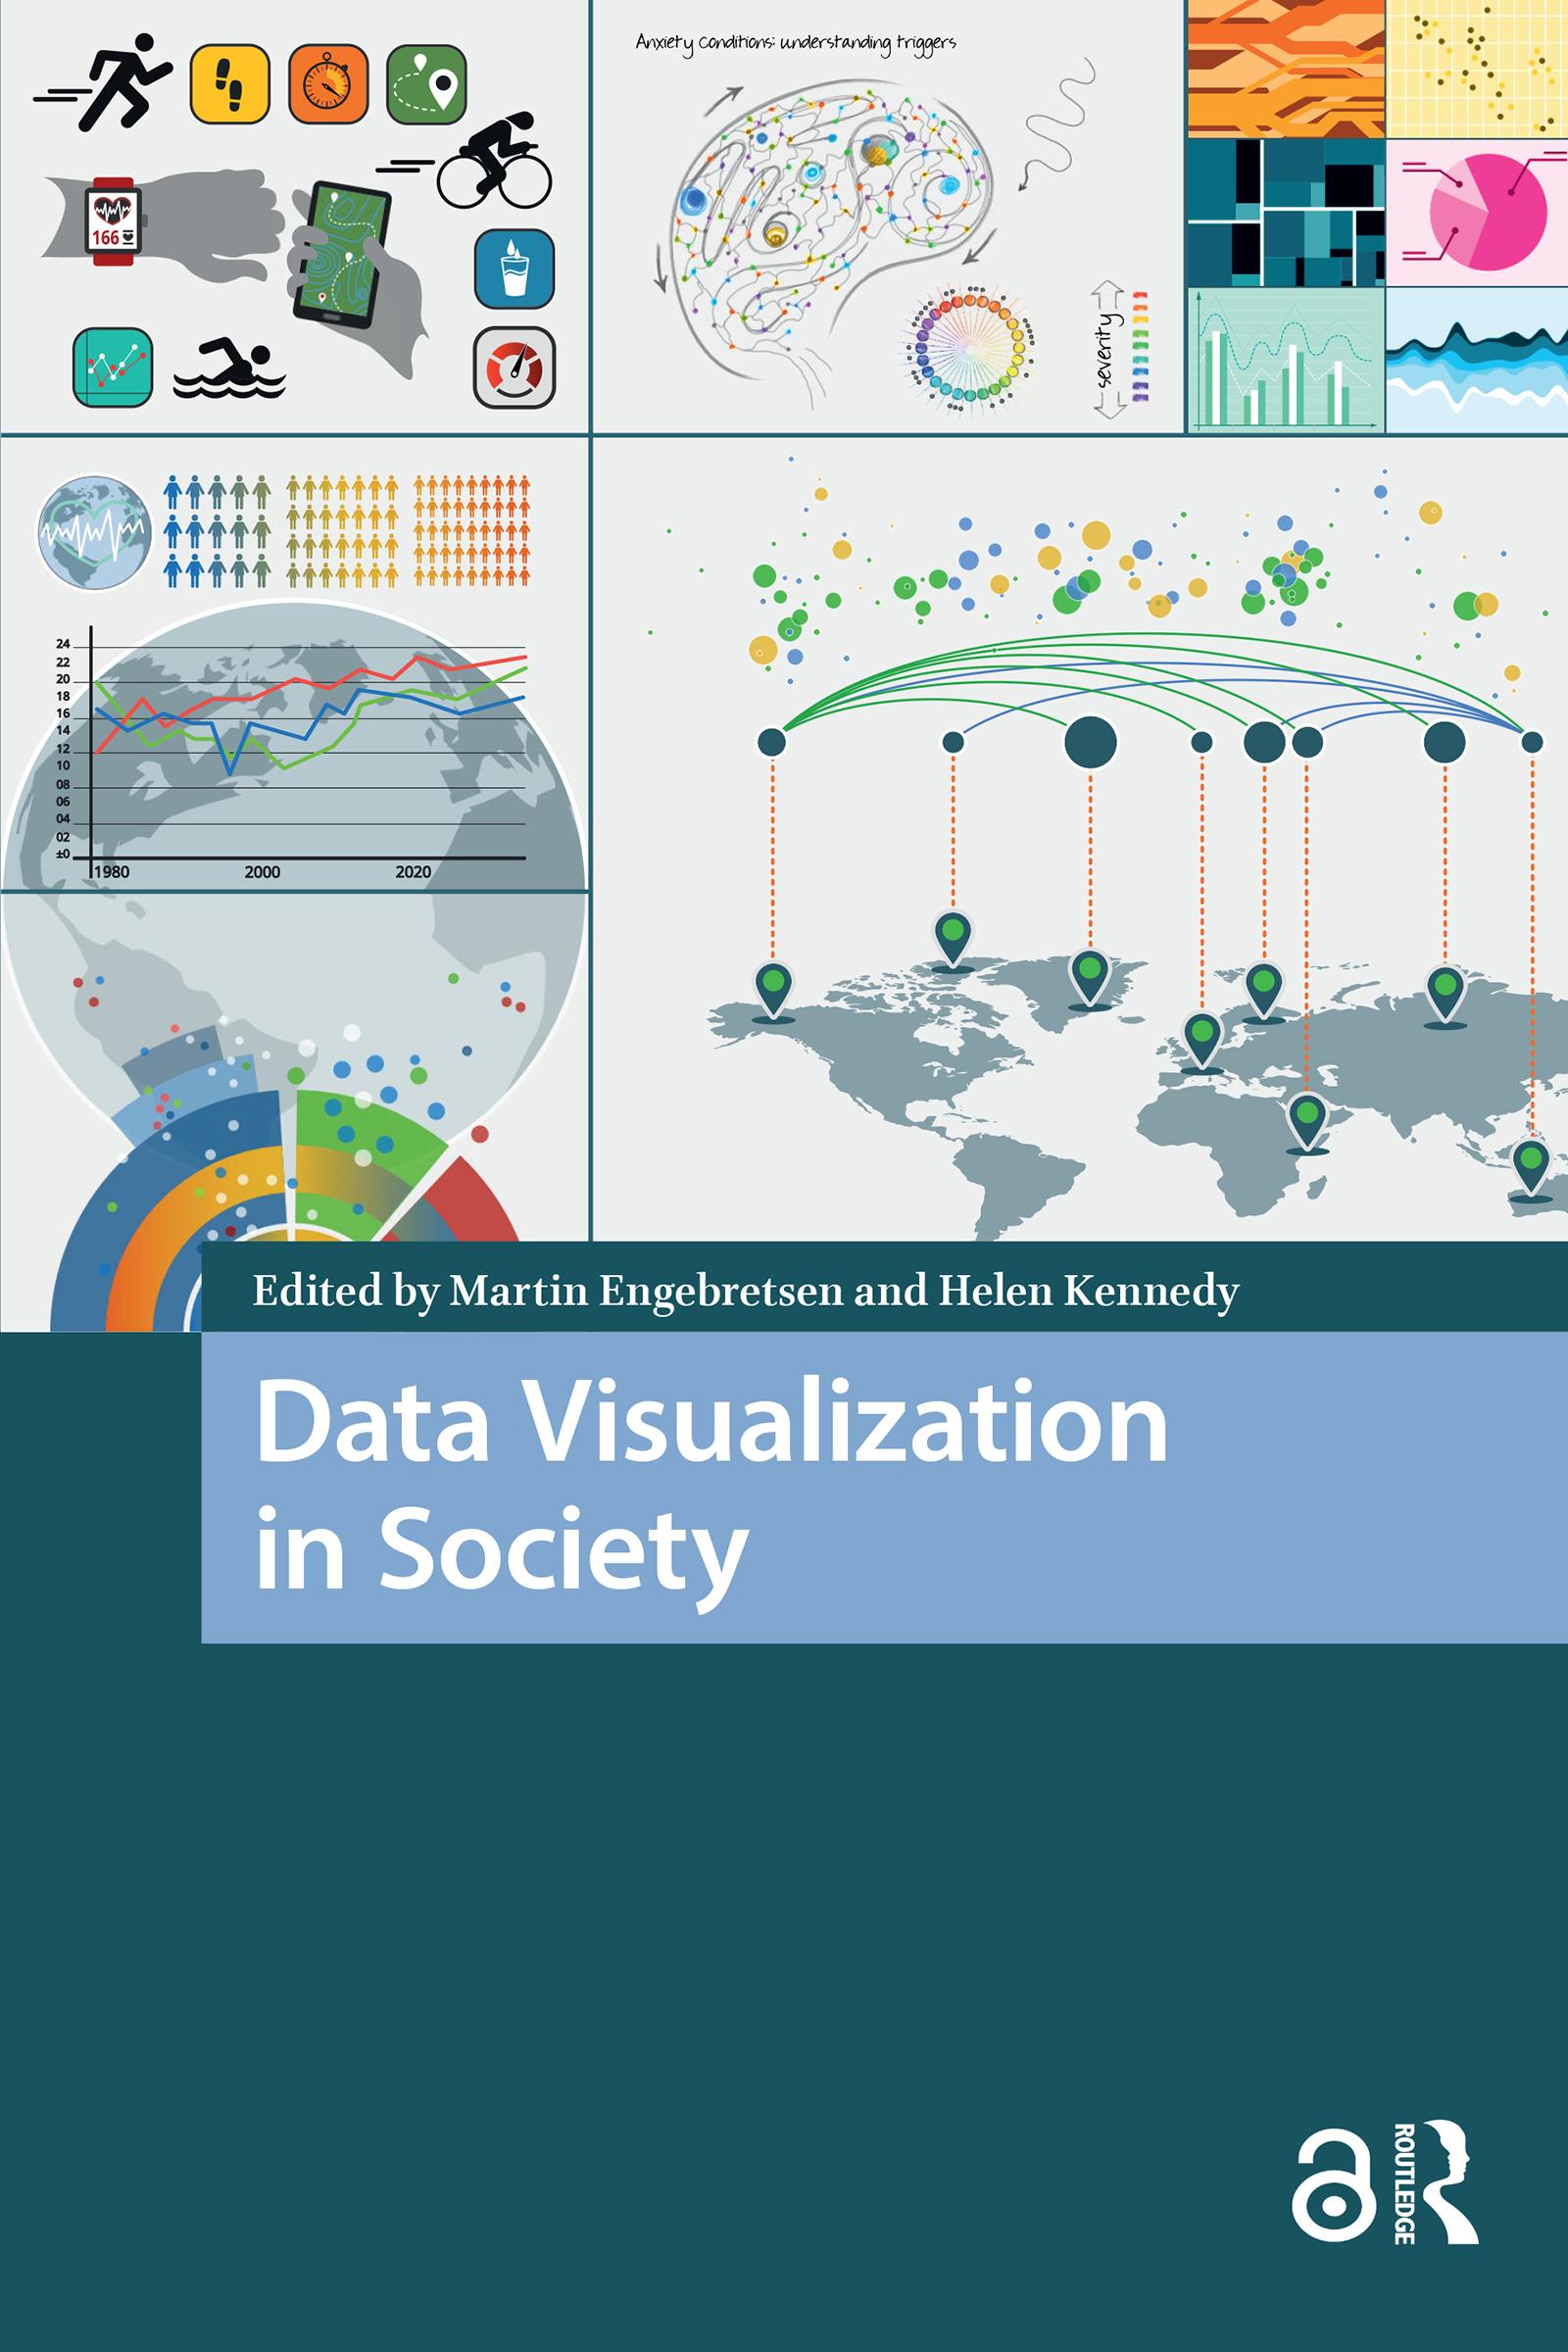
Today we are witnessing an increased use of data visualization in society. Across domains such as work, education and the news, various forms of graphs, charts and maps are used to explain, convince and tell stories. In an era in which more and more data are produced and circulated digitally, and digital tools make visualization production increasingly accessible, it is important to study the conditions under which such visual texts are generated, disseminated and thought to be of societal benefit. This book is a contribution to the multi-disciplined and multi-faceted conversation concerning the forms, uses and roles of data visualization in society. Do data visualizations do 'good' or 'bad'? Do they promote understanding and engagement, or do they do ideological work, privileging certain views of the world over others? The contributions in the book engage with these core questions from a range of disciplinary perspectives.
Pagine: 464
Categoria: Samhällsvetenskap
e-ISBN: 9781040789933
Peso di spedizione: 1.2 kg
Spedito in: 1-2 giorni
Paga facilmente con carta, Klarna, Apple Pay o Google Pay. Non sei soddisfatto? Hai sempre 14 giorni per il rimborso. Leggi di più nei nostri termini. Per qualsiasi domanda, scrivici a hello@memmo.org.
Memmo rende lo studio più facile, ovunque tu sia nel mondo. Qui trovi i tuoi libri di testo e strumenti di studio intelligenti, tutto in un unico posto: riassunti, quiz, podcast e flashcard. E poi c'è Ted, il tuo compagno di studio che risponde a ogni tua domanda. Oltre 50.000 studenti studiano già qui: è stato creato per aiutarti a imparare più velocemente e a stressarti meno.
Potrebbe interessarti anche
Acquista il libro0