
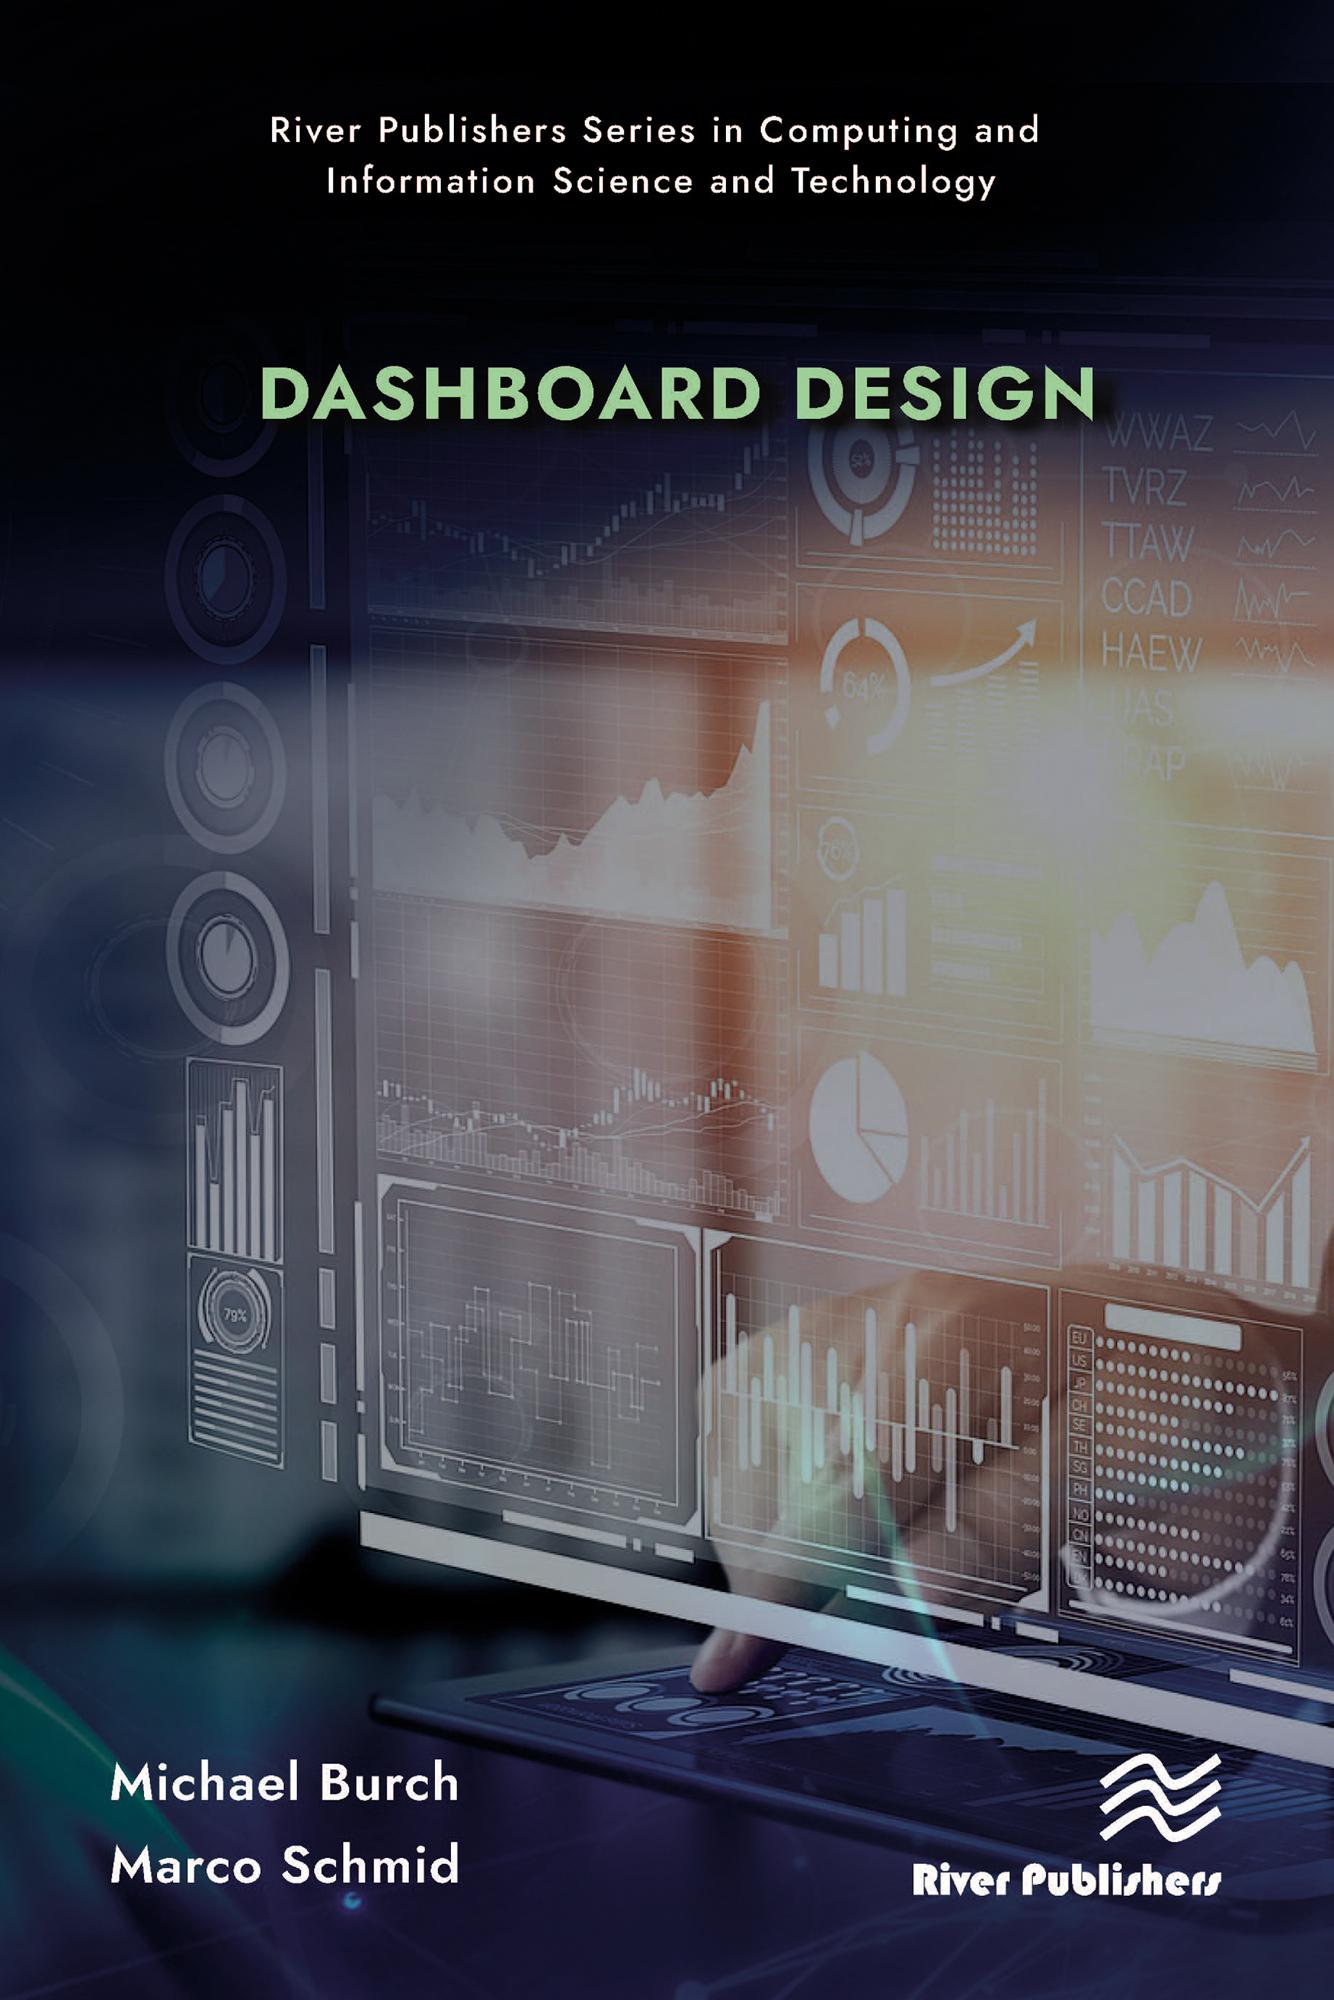
Interactive visualization and visual analytics tools have been designed and developed in the past and will be developed in the future as well. In each application domain in which data is measured, generated, and recorded we see a potential candidate for an interactive visualization tool with the goal to find insights and knowledge in the data. This knowledge can be found either visually by humans’ interventions or algorithmically by the machine, in the best case by applying both concepts in combination as in visual analytics. One of the easiest ways to get an interactive visualization tool running is by means of dashboards, typically implemented as webpages that can run in a web browser and are accessible online, creating some kind of web-based solution.
This book describes ways to design and implement dashboards based on the programming language Python, the graphics library Plotly, and Dash. The readers can use the provided dashboard codes as a starting point and extend the functionality and features on their desire.
Technical topics discussed in the book include:
- Design in visualization
- Interaction principles in information visualization
- User interface design
- Linking Python, Dash, and Plotly
- Coding in Python
- Dashboard examples with Python code.
Paga facilmente con carta, Klarna, Apple Pay o Google Pay. Non sei soddisfatto? Hai sempre 14 giorni per il rimborso. Leggi di più nei nostri termini. Per qualsiasi domanda, scrivici a hello@memmo.org.
Memmo rende lo studio più facile, ovunque tu sia nel mondo. Qui trovi i tuoi libri di testo e strumenti di studio intelligenti, tutto in un unico posto: riassunti, quiz, podcast e flashcard. E poi c'è Ted, il tuo compagno di studio che risponde a ogni tua domanda. Oltre 50.000 studenti studiano già qui: è stato creato per aiutarti a imparare più velocemente e a stressarti meno.