
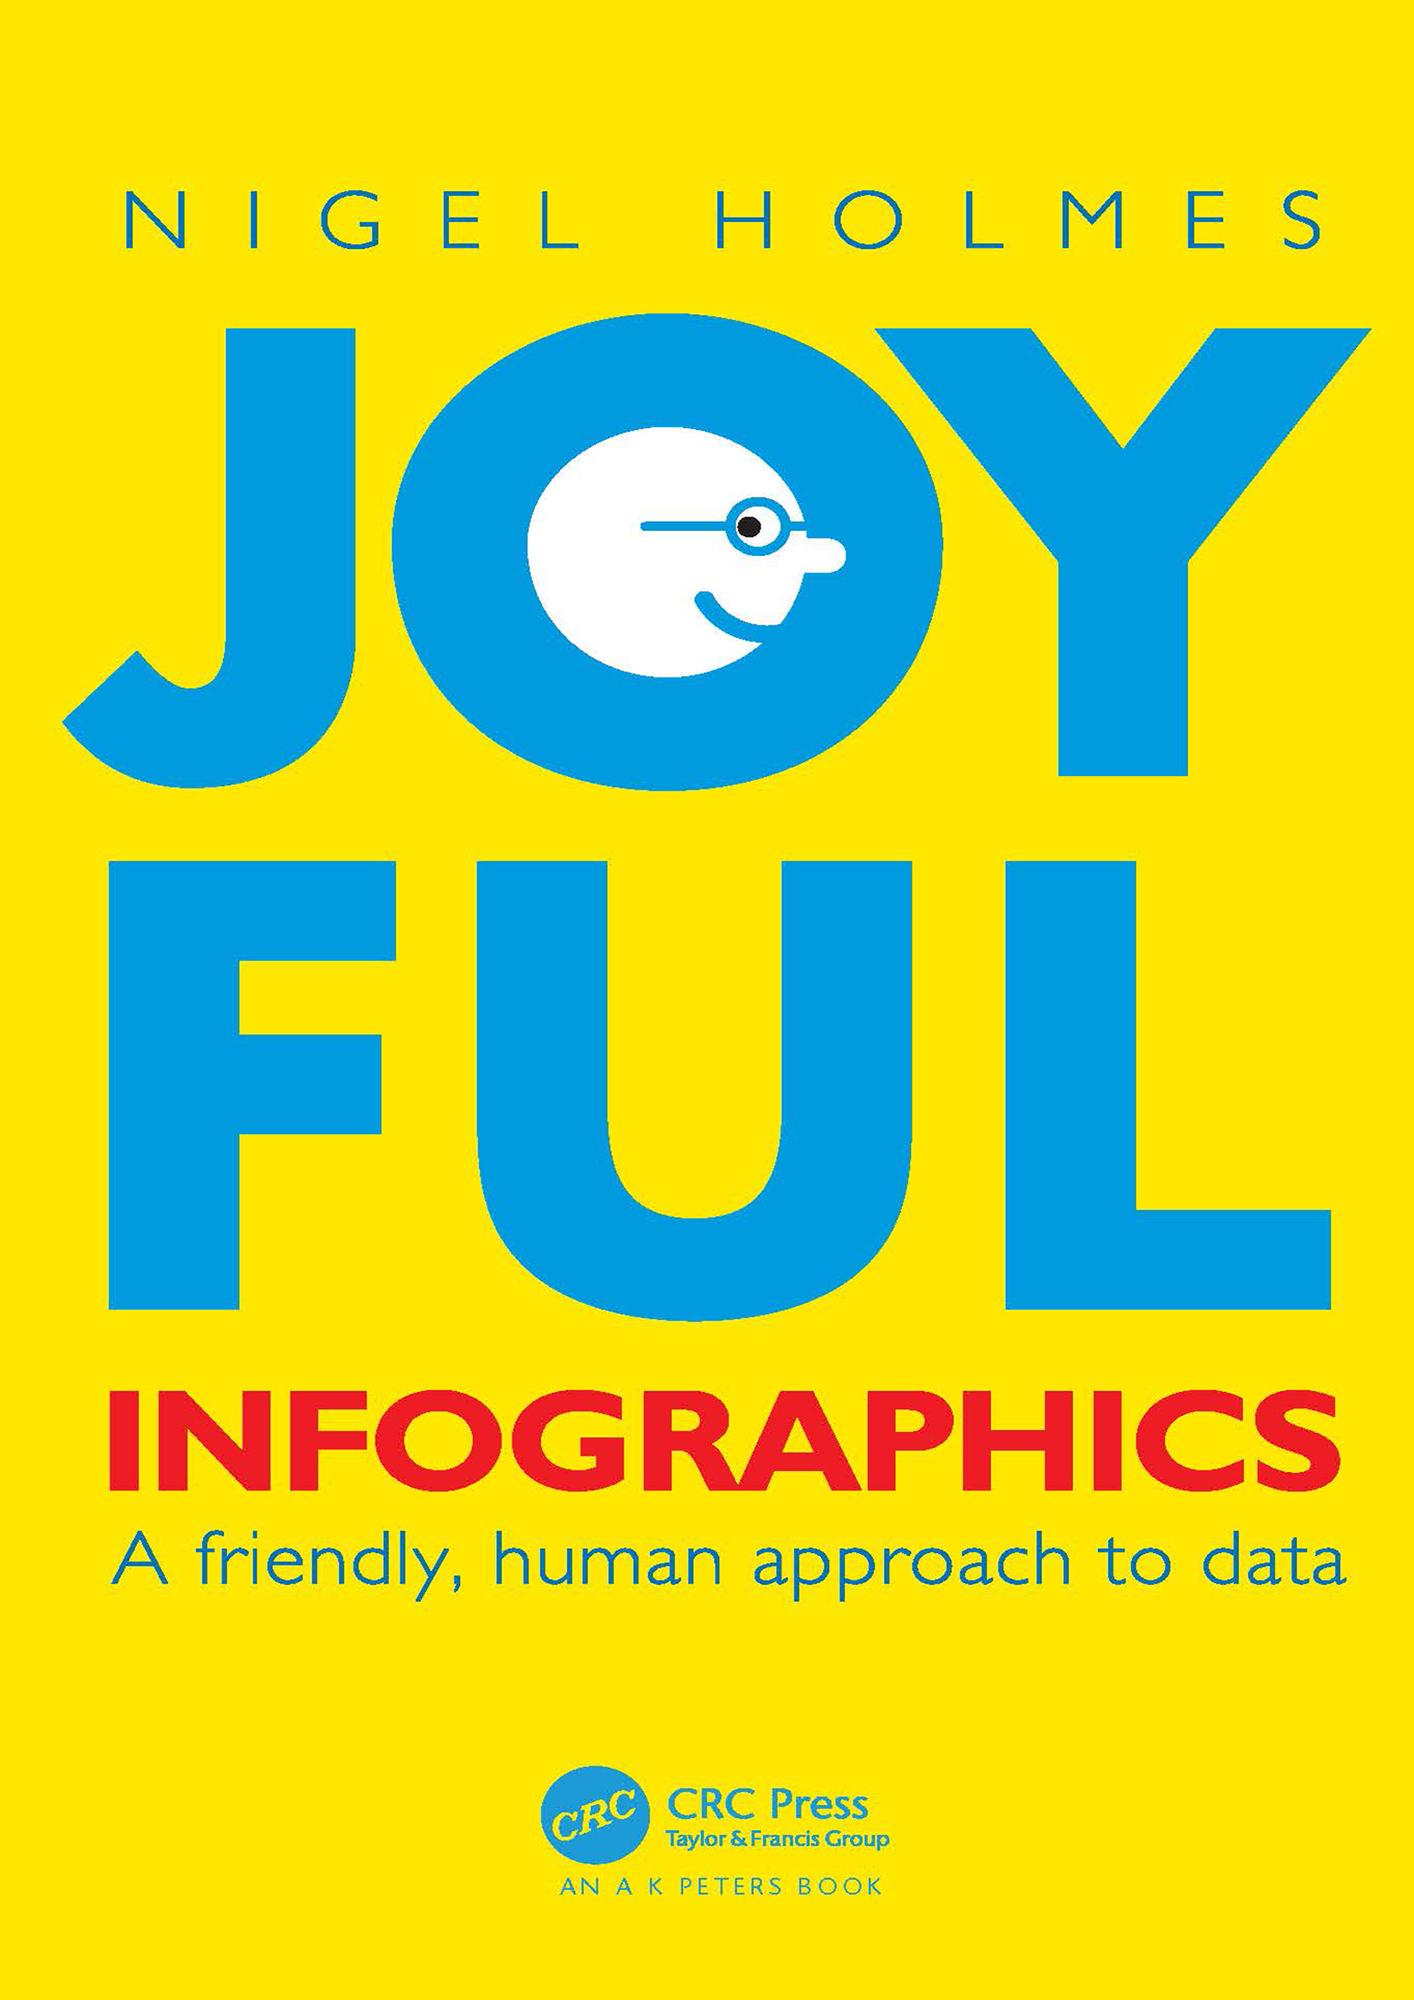
In Joyful Infographics: A Friendly, Human Approach to Data, one of the leading graphic designers of recent times shows how a judicious use of humor can make infographics more understandable. Written in non-academic, easy-to-understand language, and with historical and contemporary visual examples presented throughout, this small book provides a short history of light-hearted graphics. The text outlines nine clear ways to make graphics more understandable, explores the importance of the audience, shows you how to make information come alive during presentations through live-action ‘performance’ graphics, discusses why joy and smiling are good for you, and shows you how not to overdo it. The author website, featuring enlargeable graphics, can be found here: https://www.joyfulinfographics.com/.
Even if a subject is delicate, controversial, or taboo, being graphically friendly to the audience is the right way to explain it. It is the opposite of being clinically cold and just presenting the facts. If you can get readers to smile--the smile of recognition when they understand the graphic--you are more than halfway toward getting them to continue reading, and understanding, the intention of the piece. Joyful Infographics teaches you how to do just that.
Paga facilmente con carta, Klarna, Apple Pay o Google Pay. Non sei soddisfatto? Hai sempre 14 giorni per il rimborso. Leggi di più nei nostri termini. Per qualsiasi domanda, scrivici a hello@memmo.org.
Memmo rende lo studio più facile, ovunque tu sia nel mondo. Qui trovi i tuoi libri di testo e strumenti di studio intelligenti, tutto in un unico posto: riassunti, quiz, podcast e flashcard. E poi c'è Ted, il tuo compagno di studio che risponde a ogni tua domanda. Oltre 50.000 studenti studiano già qui: è stato creato per aiutarti a imparare più velocemente e a stressarti meno.