
First place winner in Educational Products at the 2021 International Cartographic Conference
Maps are ubiquitous, yet maps are not made equally, nor are they read equally.
Every map is a product of its maker and its reader, and maps are rarely right or wrong but simply different versions of the truth. The meaning you see in a map can reinforce or challenge your understanding of the theme it represents, and you are much more likely to believe a map if it presents a version of the truth that you believe in already.
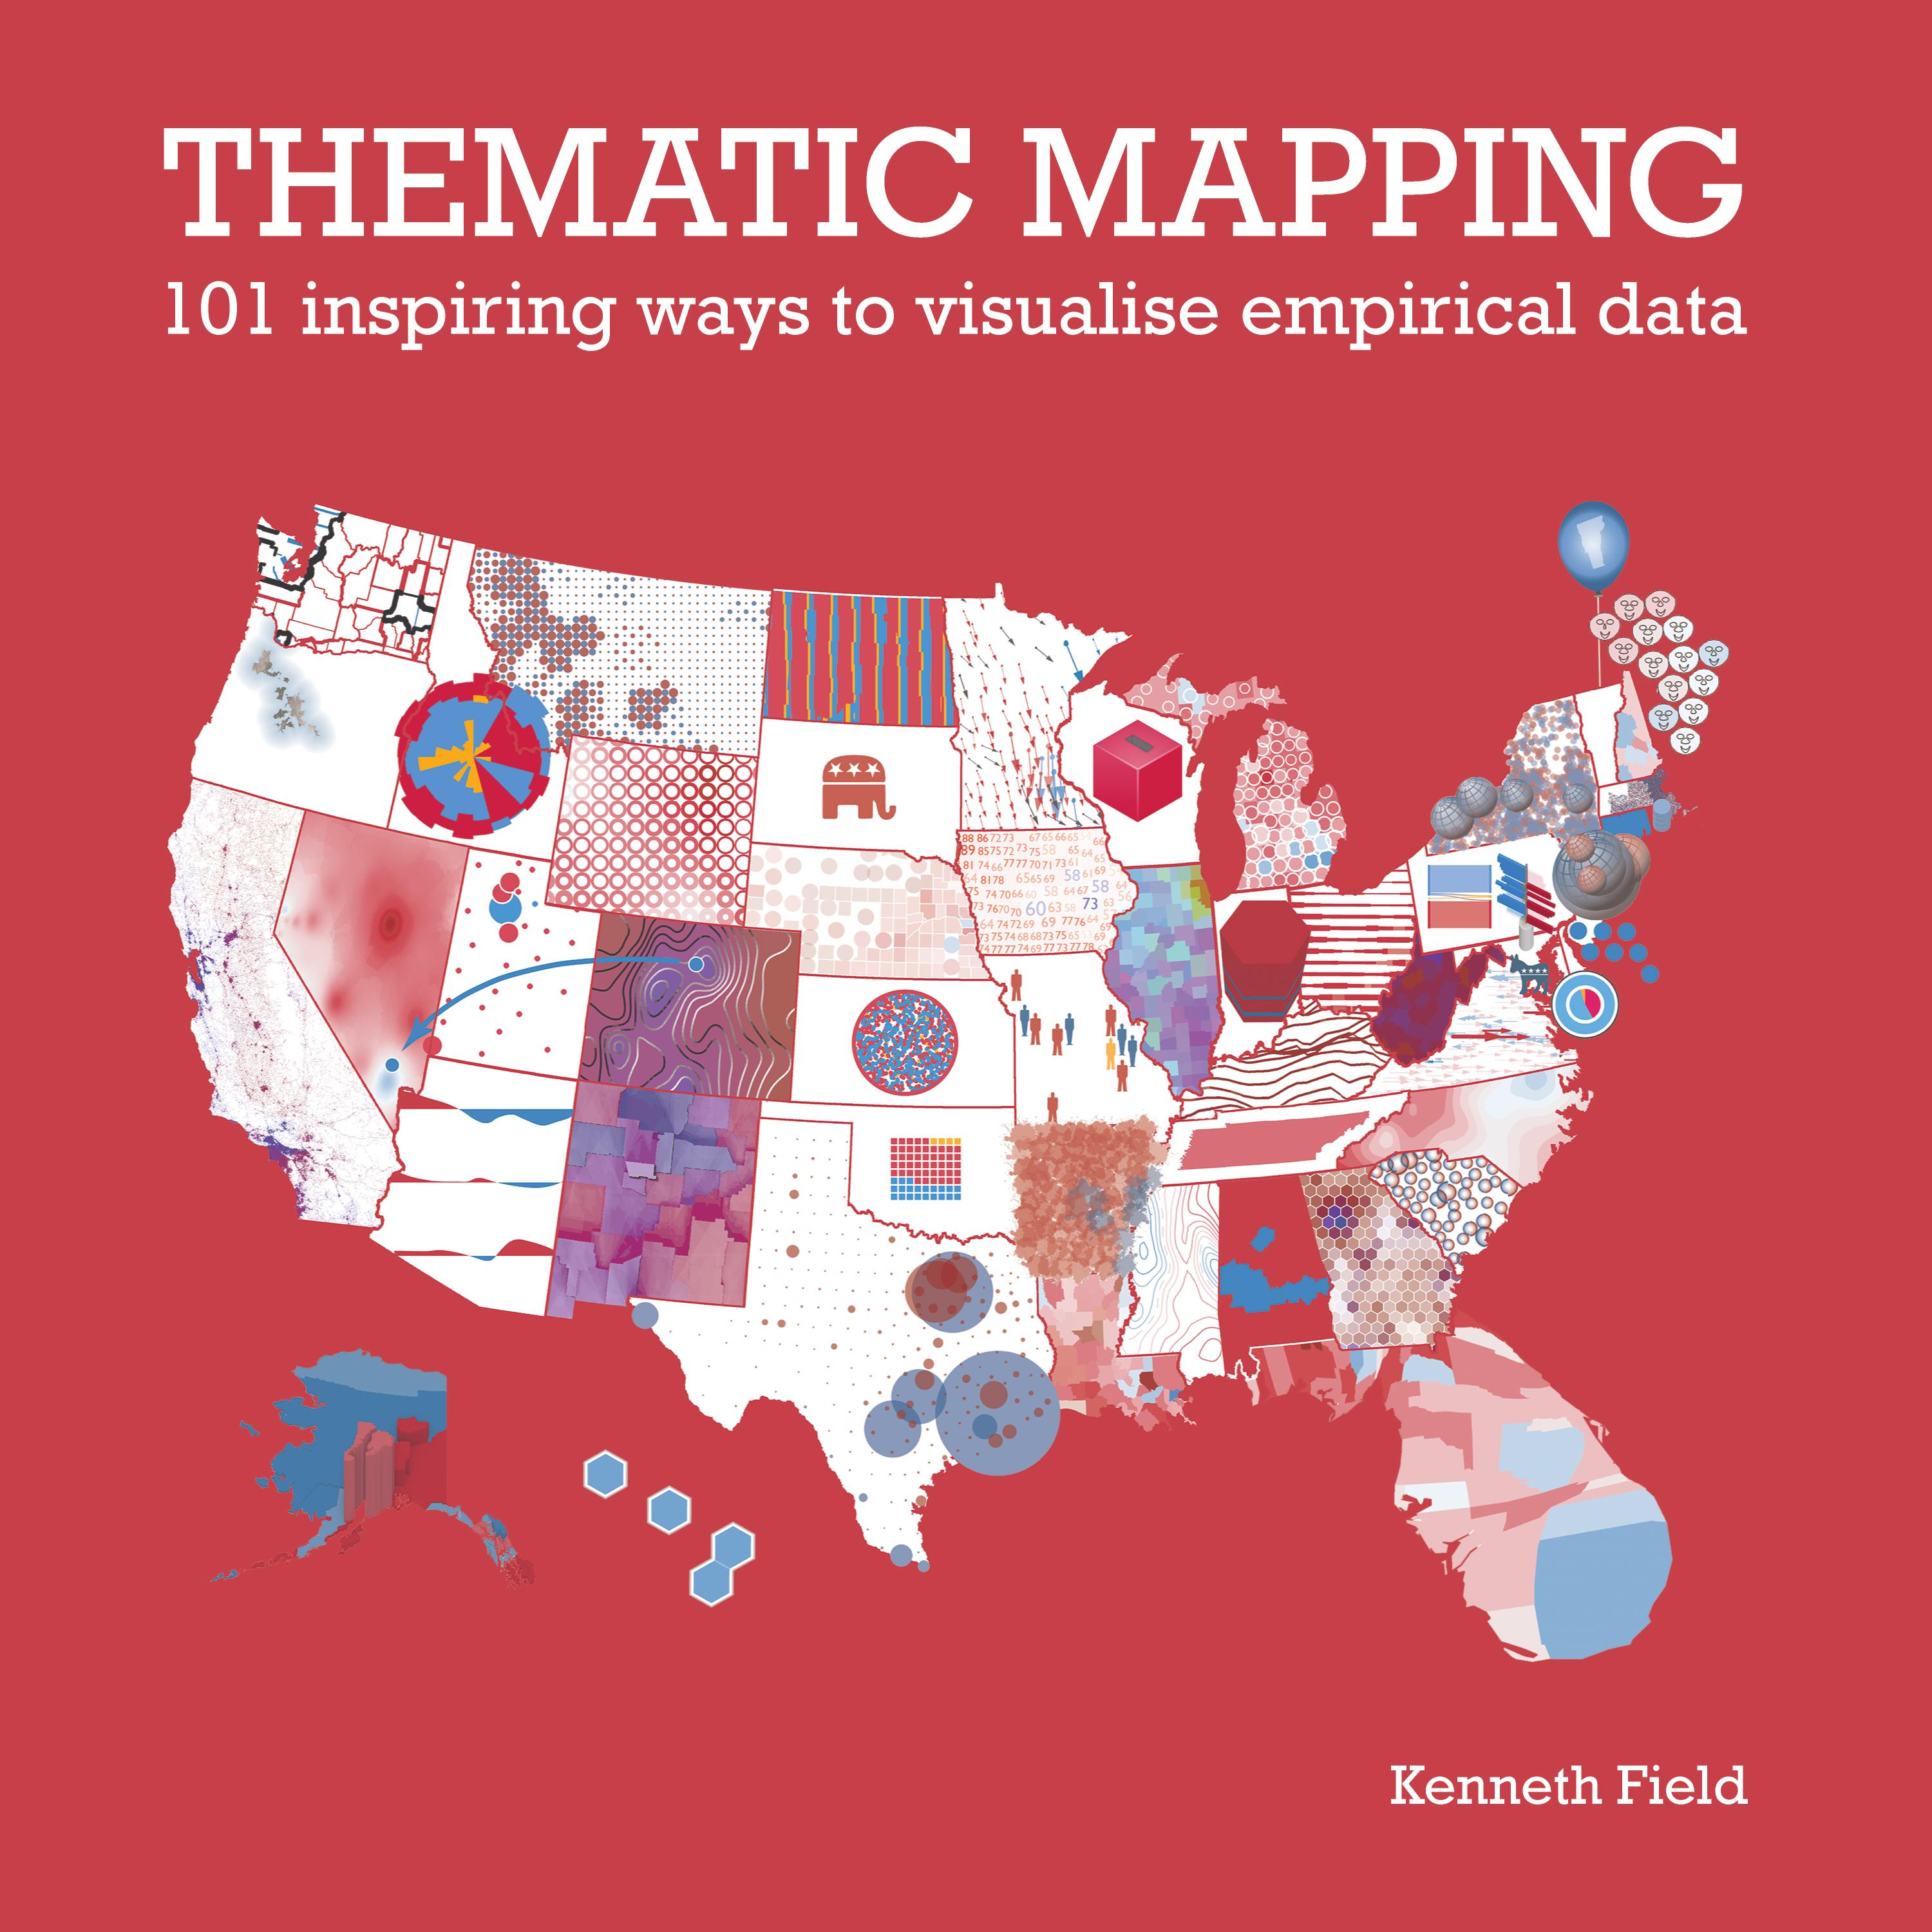
But how do you decide what map you want to make? How do you understand the way in which different maps can be used in different ways to tell a story? How do you design a map to be read in a particular way? Thematic Mapping: 101 Inspiring Ways to Visualise Empirical Data answers these questions, and more.
Using 101 maps, graphs, charts, and plots of the 2016 United States presidential election data, Thematic Mapping explores the rich diversity of thematic mapping and the visual representation of data. It details well-known techniques and demonstrates how to design effective maps and graphics. Each map illustrates a different approach to the same data, and all lead to different maps and different ways of seeing different shades of truth.
Thematic Mapping examines the innovative and fascinating alternative ways of making maps of data which you can use in your own work. Which will speak to your truth?
Betal nemt med kort, Klarna, Apple Pay eller Google Pay. Ikke tilfreds? Du har altid 14 dages fortrydelsesret. Læs mere i vores vilkår. Har du spørgsmål, så send os en mail på hello@memmo.org.
Memmo gør det nemmere at studere – uanset hvor du er i verden. Hos os samler du dine kursusbøger og smarte studieværktøjer ét sted: resuméer, quizzer, podcasts og flashcards. Og så er der Ted, din studieven, der svarer på alt, du undrer dig over. Over 50 000 studerende studerer allerede her – bygget til at hjælpe dig med at lære hurtigere og stresse mindre.