
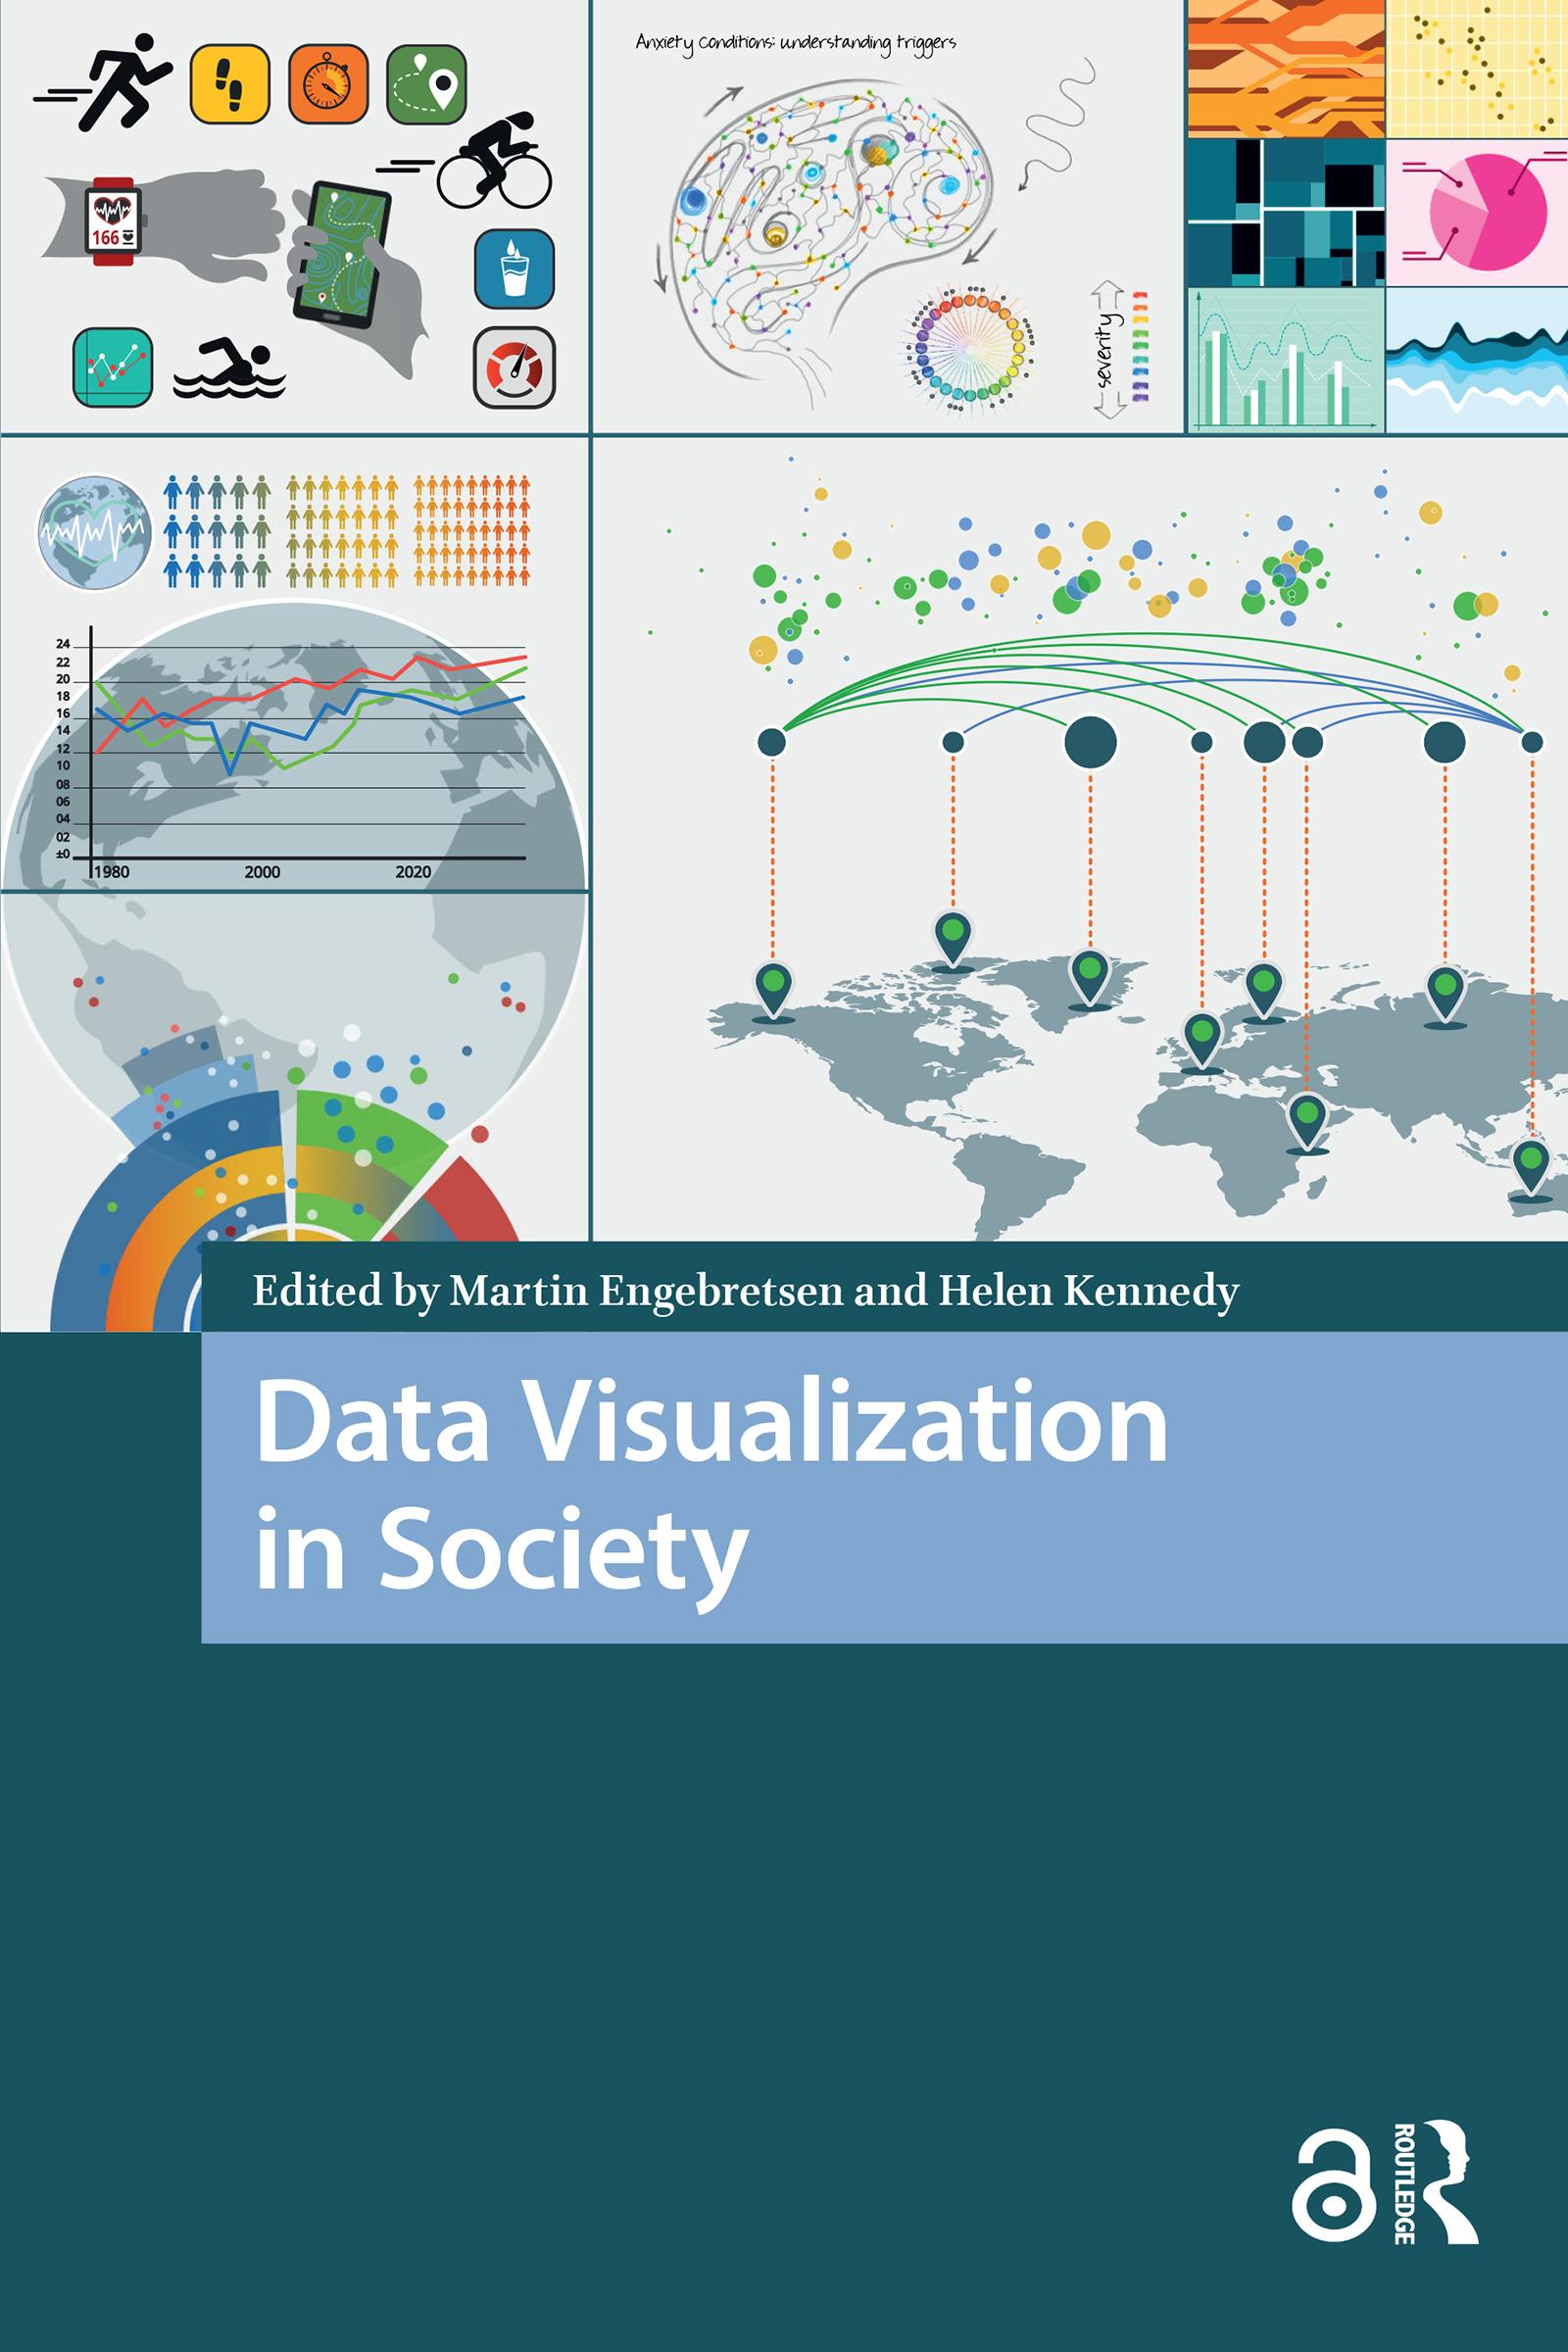
Today we are witnessing an increased use of data visualization in society. Across domains such as work, education and the news, various forms of graphs, charts and maps are used to explain, convince and tell stories. In an era in which more and more data are produced and circulated digitally, and digital tools make visualization production increasingly accessible, it is important to study the conditions under which such visual texts are generated, disseminated and thought to be of societal benefit. This book is a contribution to the multi-disciplined and multi-faceted conversation concerning the forms, uses and roles of data visualization in society. Do data visualizations do 'good' or 'bad'? Do they promote understanding and engagement, or do they do ideological work, privileging certain views of the world over others? The contributions in the book engage with these core questions from a range of disciplinary perspectives.
Sider: 464
Kategori: Samhällsvetenskap
e-ISBN: 9781040789933
Forsendelsesvægt: 1.2 kg
Sendes inden for: 1-2 dage
Betal nemt med kort, Klarna, Apple Pay eller Google Pay. Ikke tilfreds? Du har altid 14 dages fortrydelsesret. Læs mere i vores vilkår. Har du spørgsmål, så send os en mail på hello@memmo.org.
Memmo gør det nemmere at studere – uanset hvor du er i verden. Hos os samler du dine kursusbøger og smarte studieværktøjer ét sted: resuméer, quizzer, podcasts og flashcards. Og så er der Ted, din studieven, der svarer på alt, du undrer dig over. Over 50 000 studerende studerer allerede her – bygget til at hjælpe dig med at lære hurtigere og stresse mindre.
Du kan måske også lide
Køb bogen0