
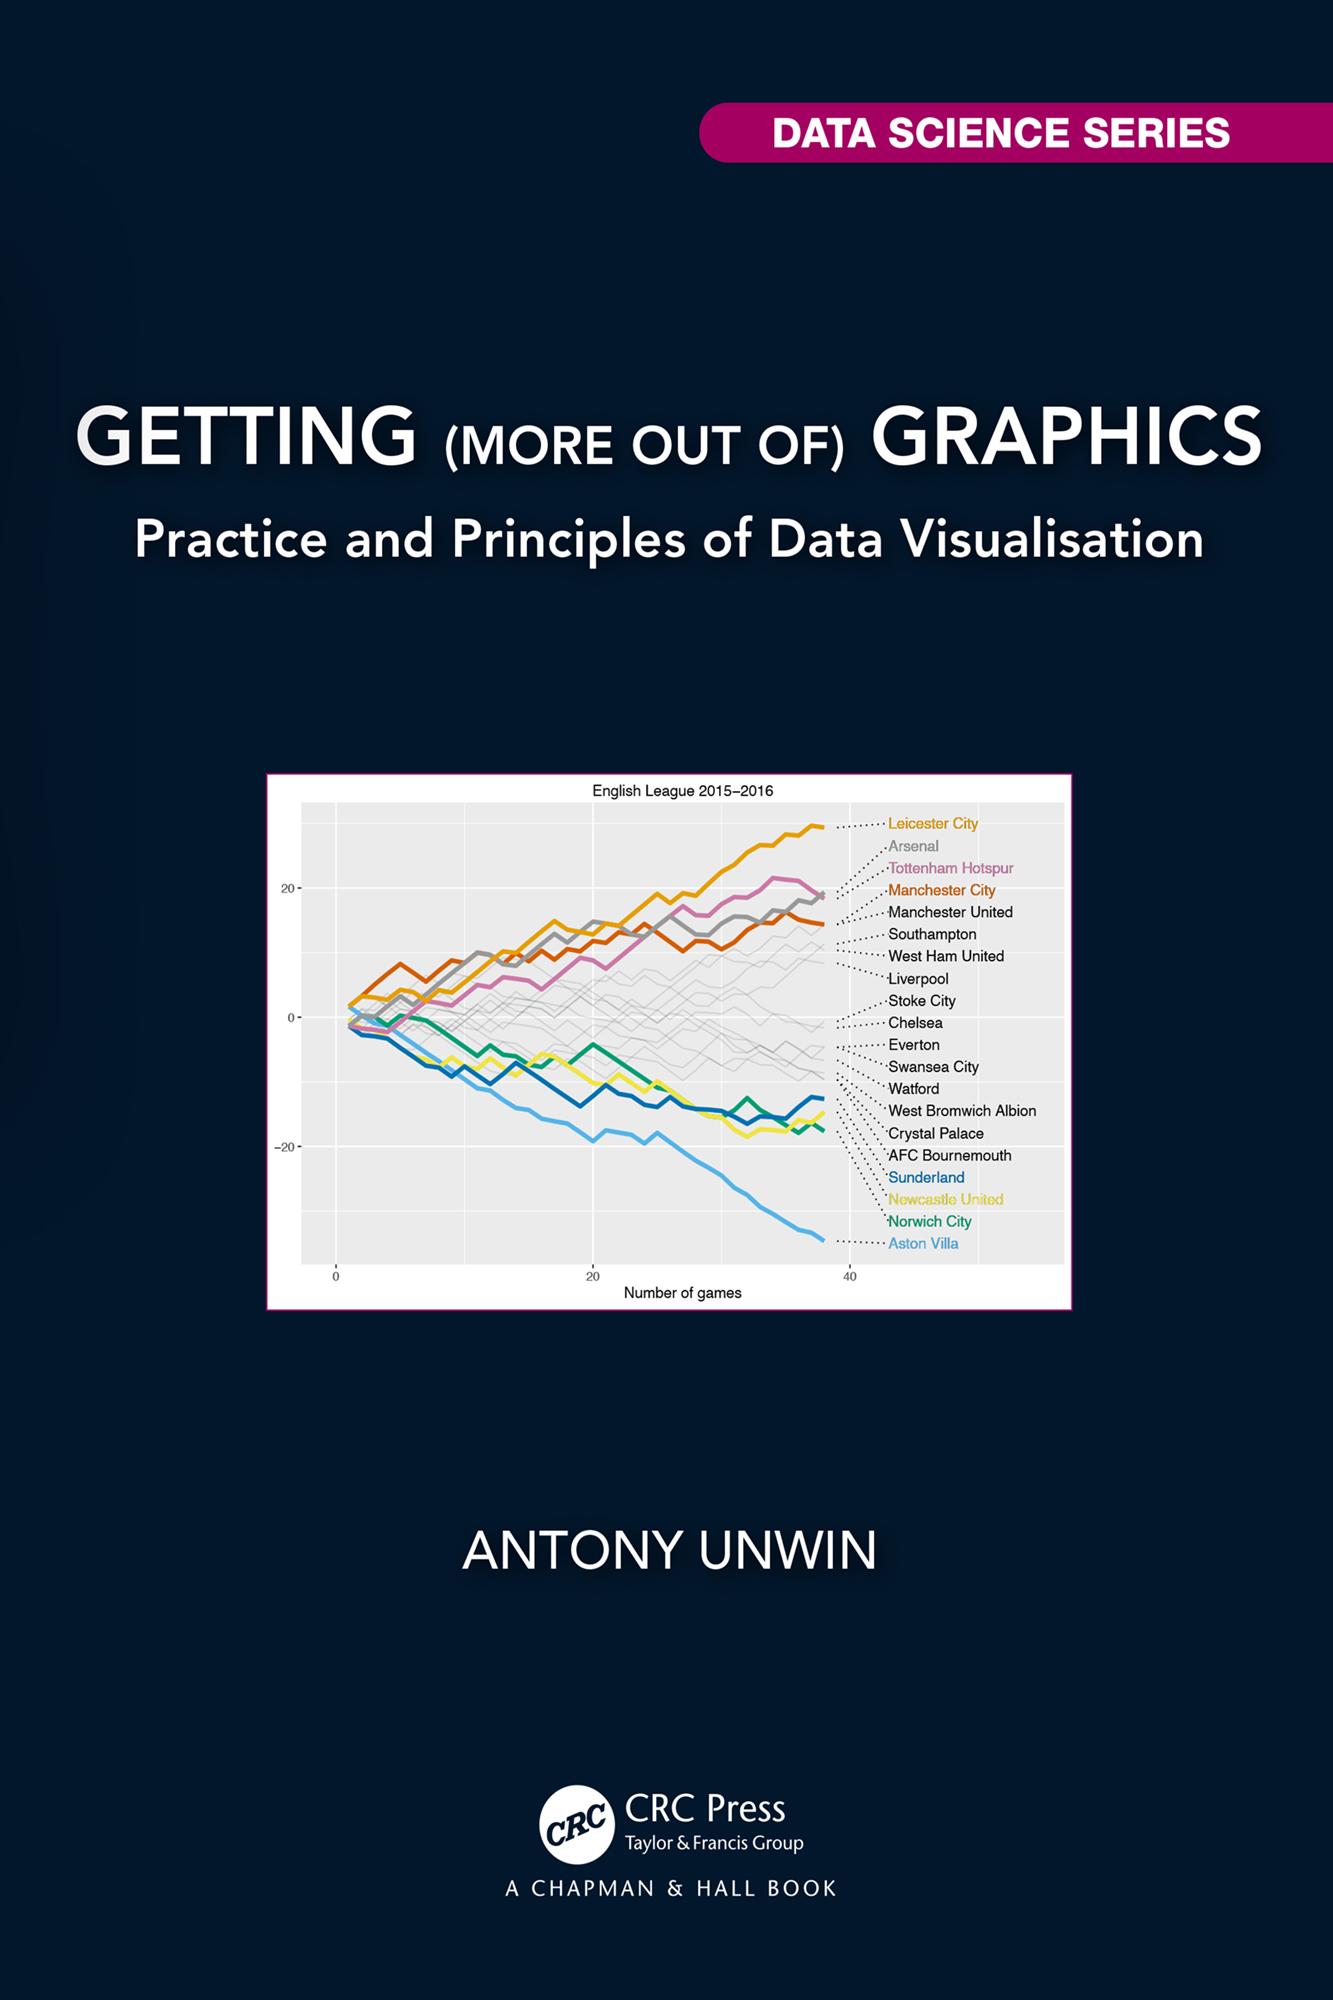
Data graphics are used extensively to present information. Understanding graphics is a lot about understanding the data represented by the graphics, having a feel not just for the numbers themselves, the reliability and uncertainty associated with them, but also for what they mean. This book presents a practical approach to data visualisation with real applications front and centre.
The first part of the book is a series of case studies, each describing a graphical analysis of a real dataset. The second part pulls together ideas from the case studies and provides an overview of the main factors affecting understanding graphics.
Key Features:
- Explains how to get insights from graphics.
- Emphasises the value of drawing many graphics.
- Underlines the importance for analysis of background knowledge and context.
Readers may be data scientists, statisticians or people who want to become more visually literate. A knowledge of Statistics is not required, just an interest in data graphics and some experience of working with data. It will help if the reader knows something of basic graphic forms such as barcharts, histograms, and scatterplots.
Betal nemt med kort, Klarna, Apple Pay eller Google Pay. Ikke tilfreds? Du har altid 14 dages fortrydelsesret. Læs mere i vores vilkår. Har du spørgsmål, så send os en mail på hello@memmo.org.
Memmo gør det nemmere at studere – uanset hvor du er i verden. Hos os samler du dine kursusbøger og smarte studieværktøjer ét sted: resuméer, quizzer, podcasts og flashcards. Og så er der Ted, din studieven, der svarer på alt, du undrer dig over. Over 50 000 studerende studerer allerede her – bygget til at hjælpe dig med at lære hurtigere og stresse mindre.